
AMD’s Ryzen 7000X3D processors are designed and marketed for gamers. While the Ryzen 9 7900X3D/7950X3D may appeal to content creators, the 7800X3D is squarely meant for PC gamers. A while back, we tested the 7950X3D, comparing it to the Core i9-13900K. The result was pretty much a tie. In this one, we’ll test the Ryzen 7 7800X3D, comparing its performance to the 13900K, with and without ray-tracing.
Test Bench
- Motherboard: ASUS ROG Maximus Hero Z790/X670.
- Memory: 16GB x2 DDR5 6,000MT/s CL38.
- GPU: NVIDIA GeForce 4090 24GB FE.
- Power Supply: Corsair RM1000E.
AMD Ryzen 7 7800X3D vs Intel Core i9-13900K Gaming Benchmarks
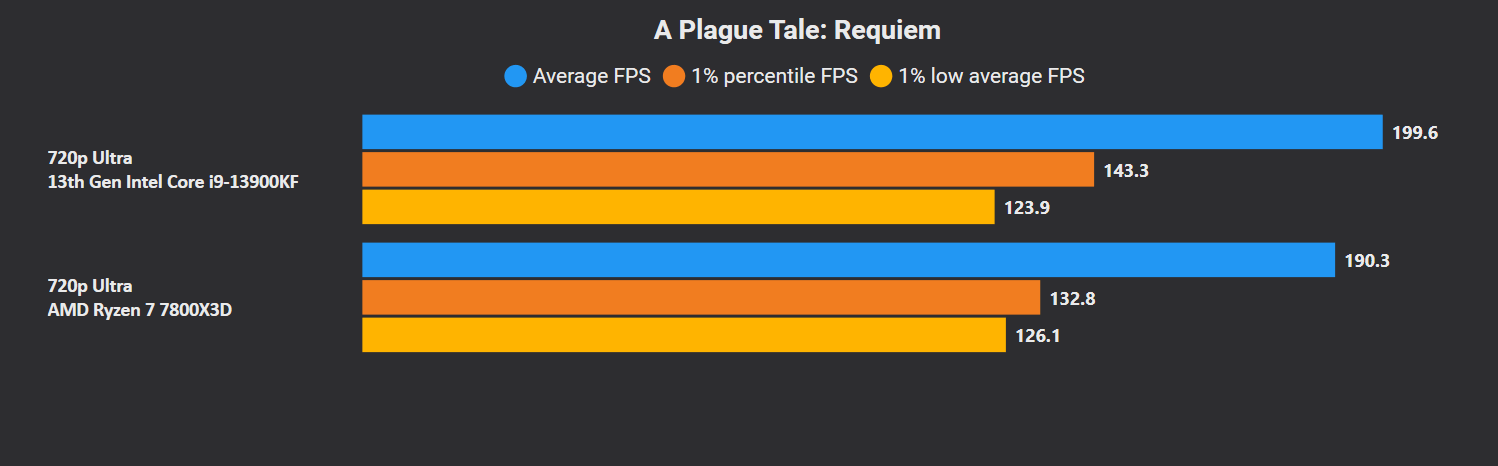
The Core i9-13900K marks its first win in “A Plague Tale: Requiem”. The Ryzen 7 7800X3D isn’t far behind with an average delta of just 5%.

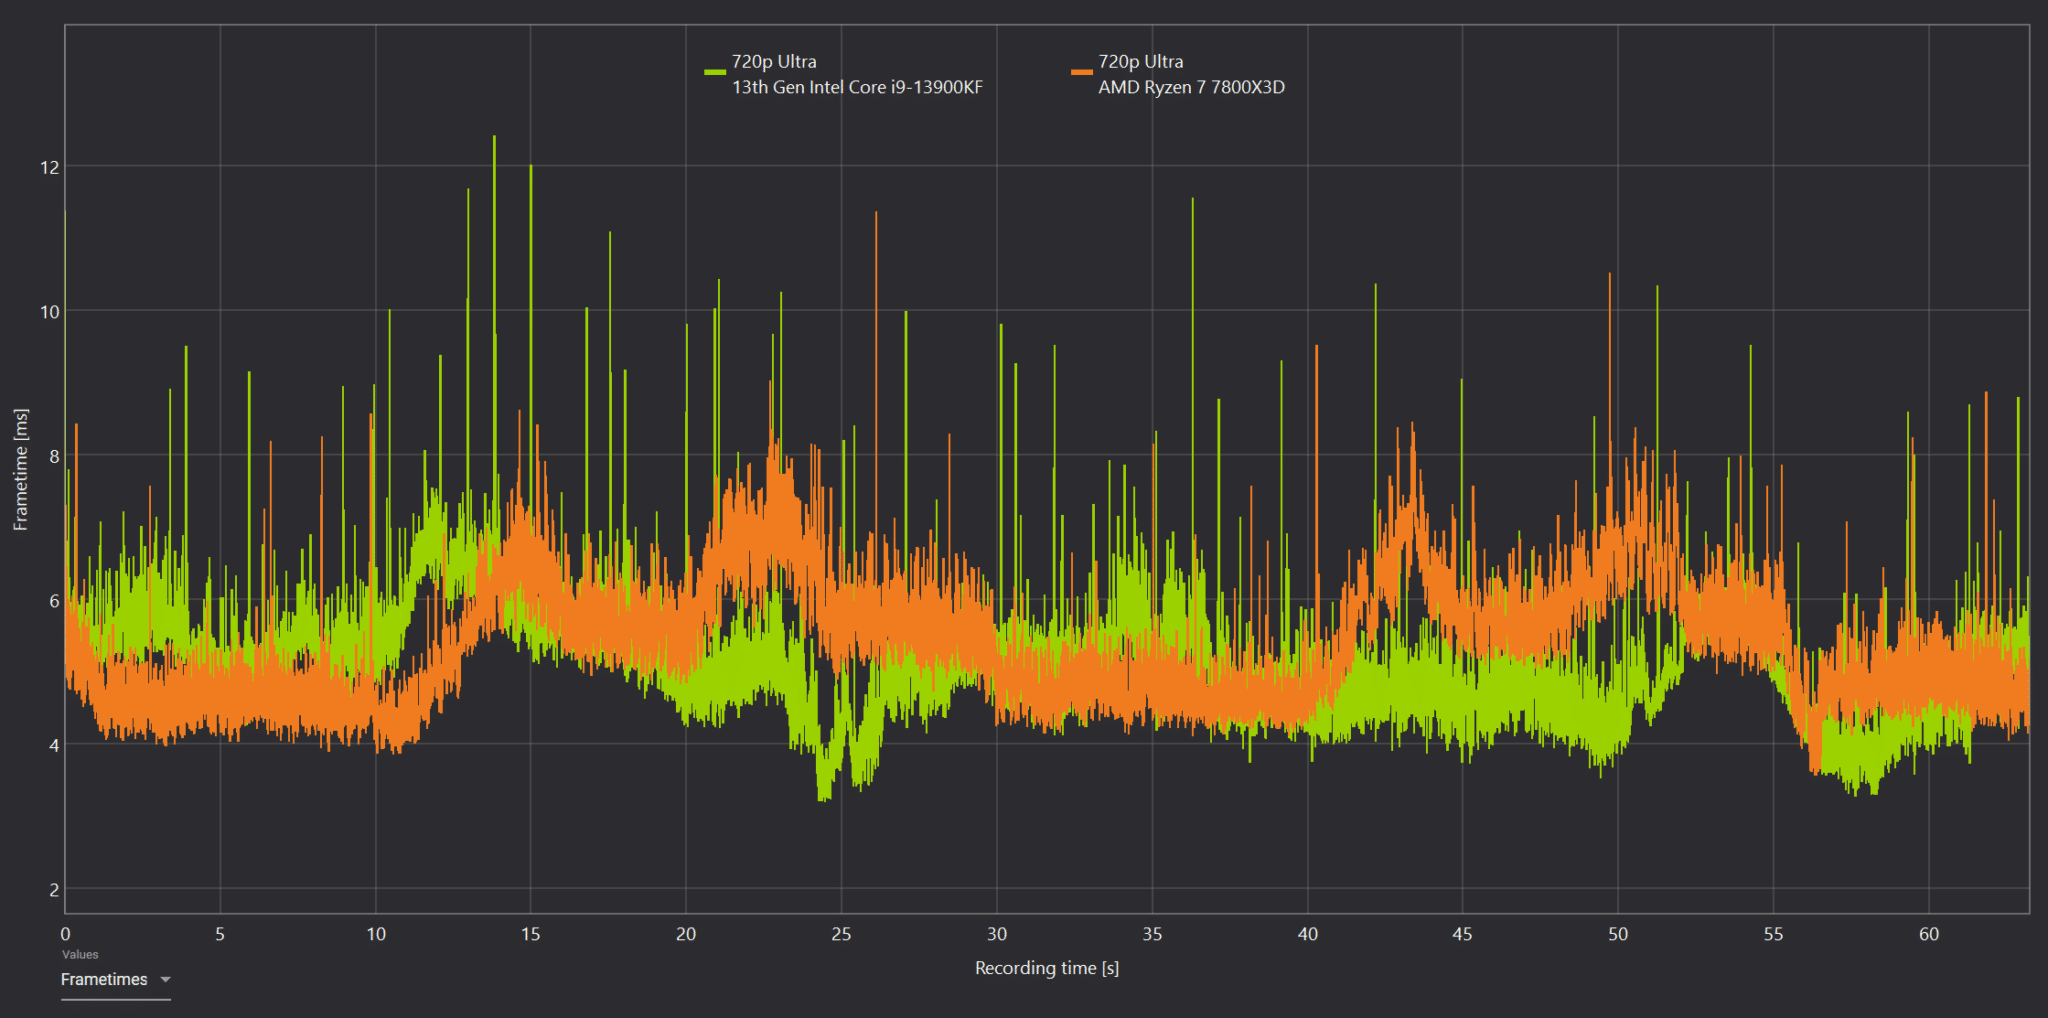
Looking at the frametime data, you can see that the Ryzen 7 7800X3D has fewer spikes, resulting in a smoother gameplay experience.
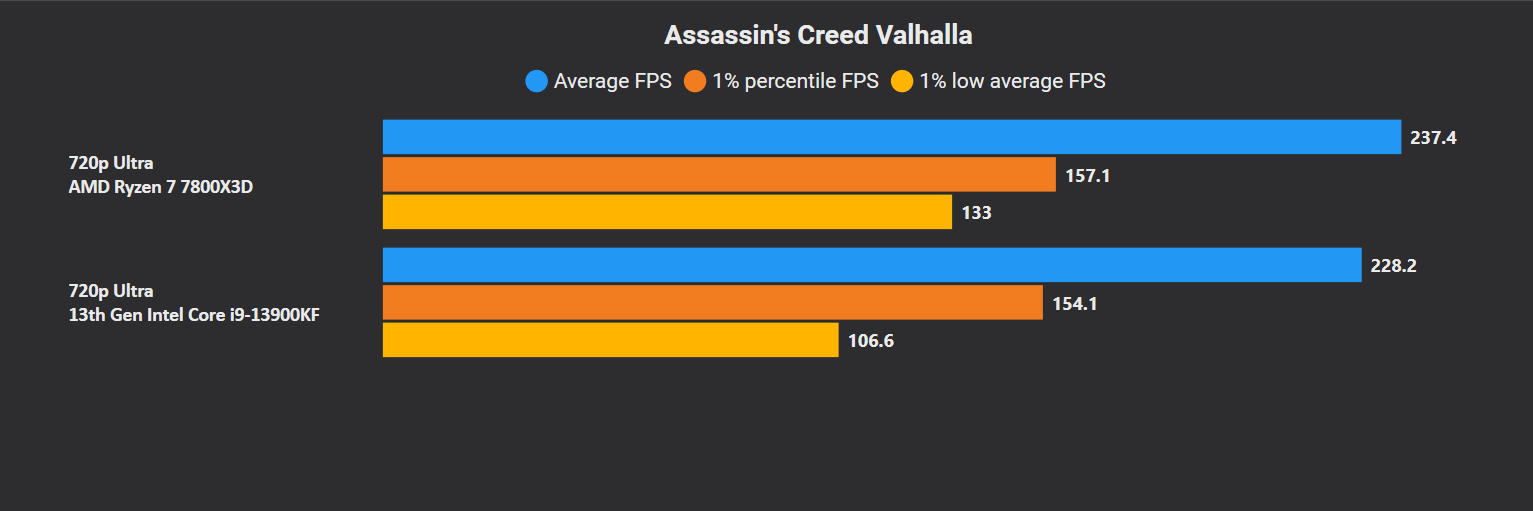
Assassins’ Creed Valhalla is the opposite, granting the Ryzen 7 7800X3D a slim lead with notably higher lows.

All recent Assassin’s Creed games exhibit the following stuttery behavior on even the fastest CPUs. And it’s still not fixed.
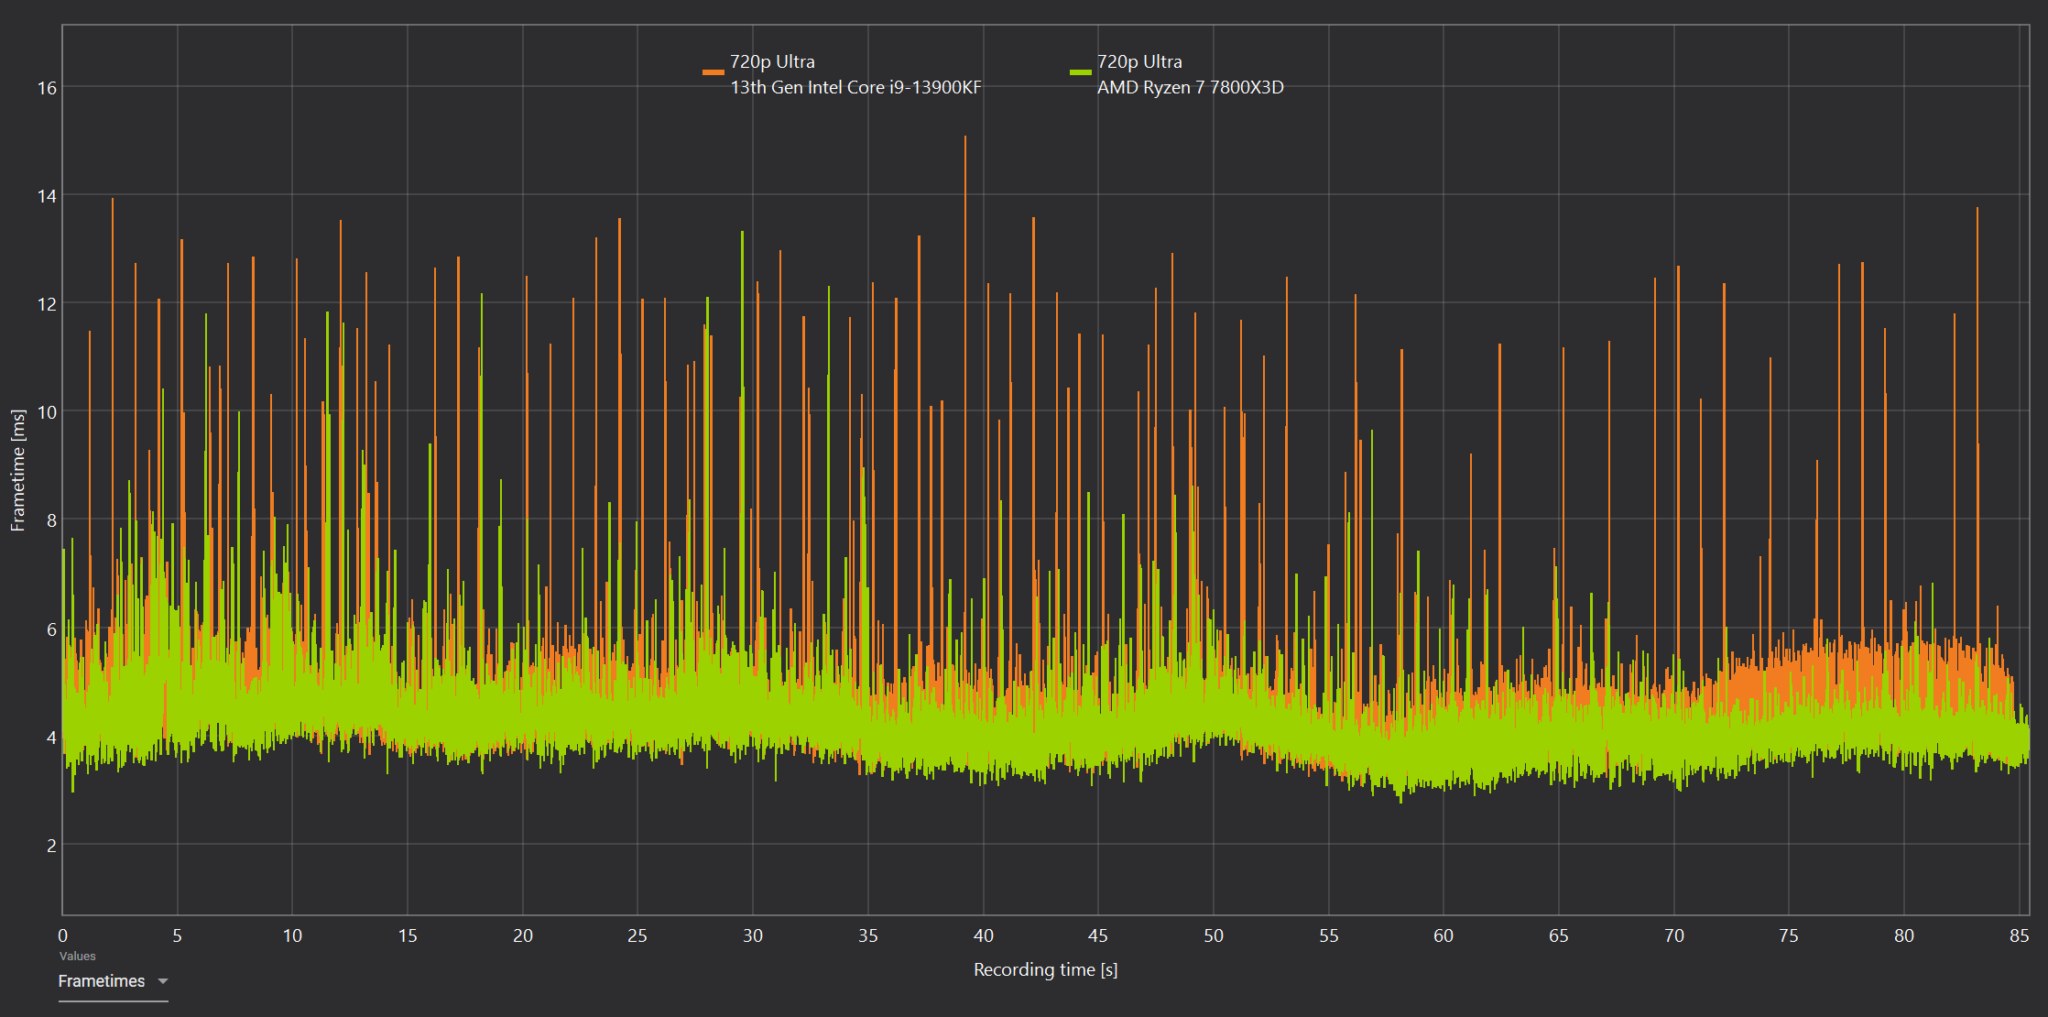
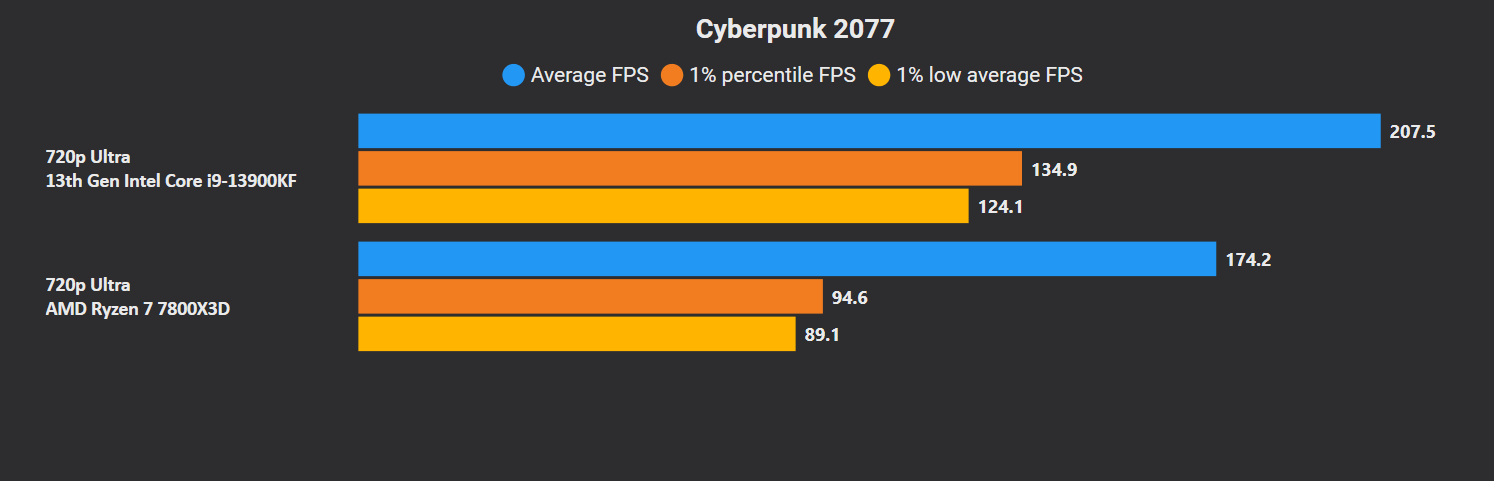
Cyberpunk 2077 has gone from the worst-optimized to the most-optimized title within a year. The Core i9-13900K is the clear winner here with a lead of 20%.

The frametime data indicates a bit of stuttering on the Ryzen side towards the end of the benchmark. The 13900K has similar but smaller spikes.
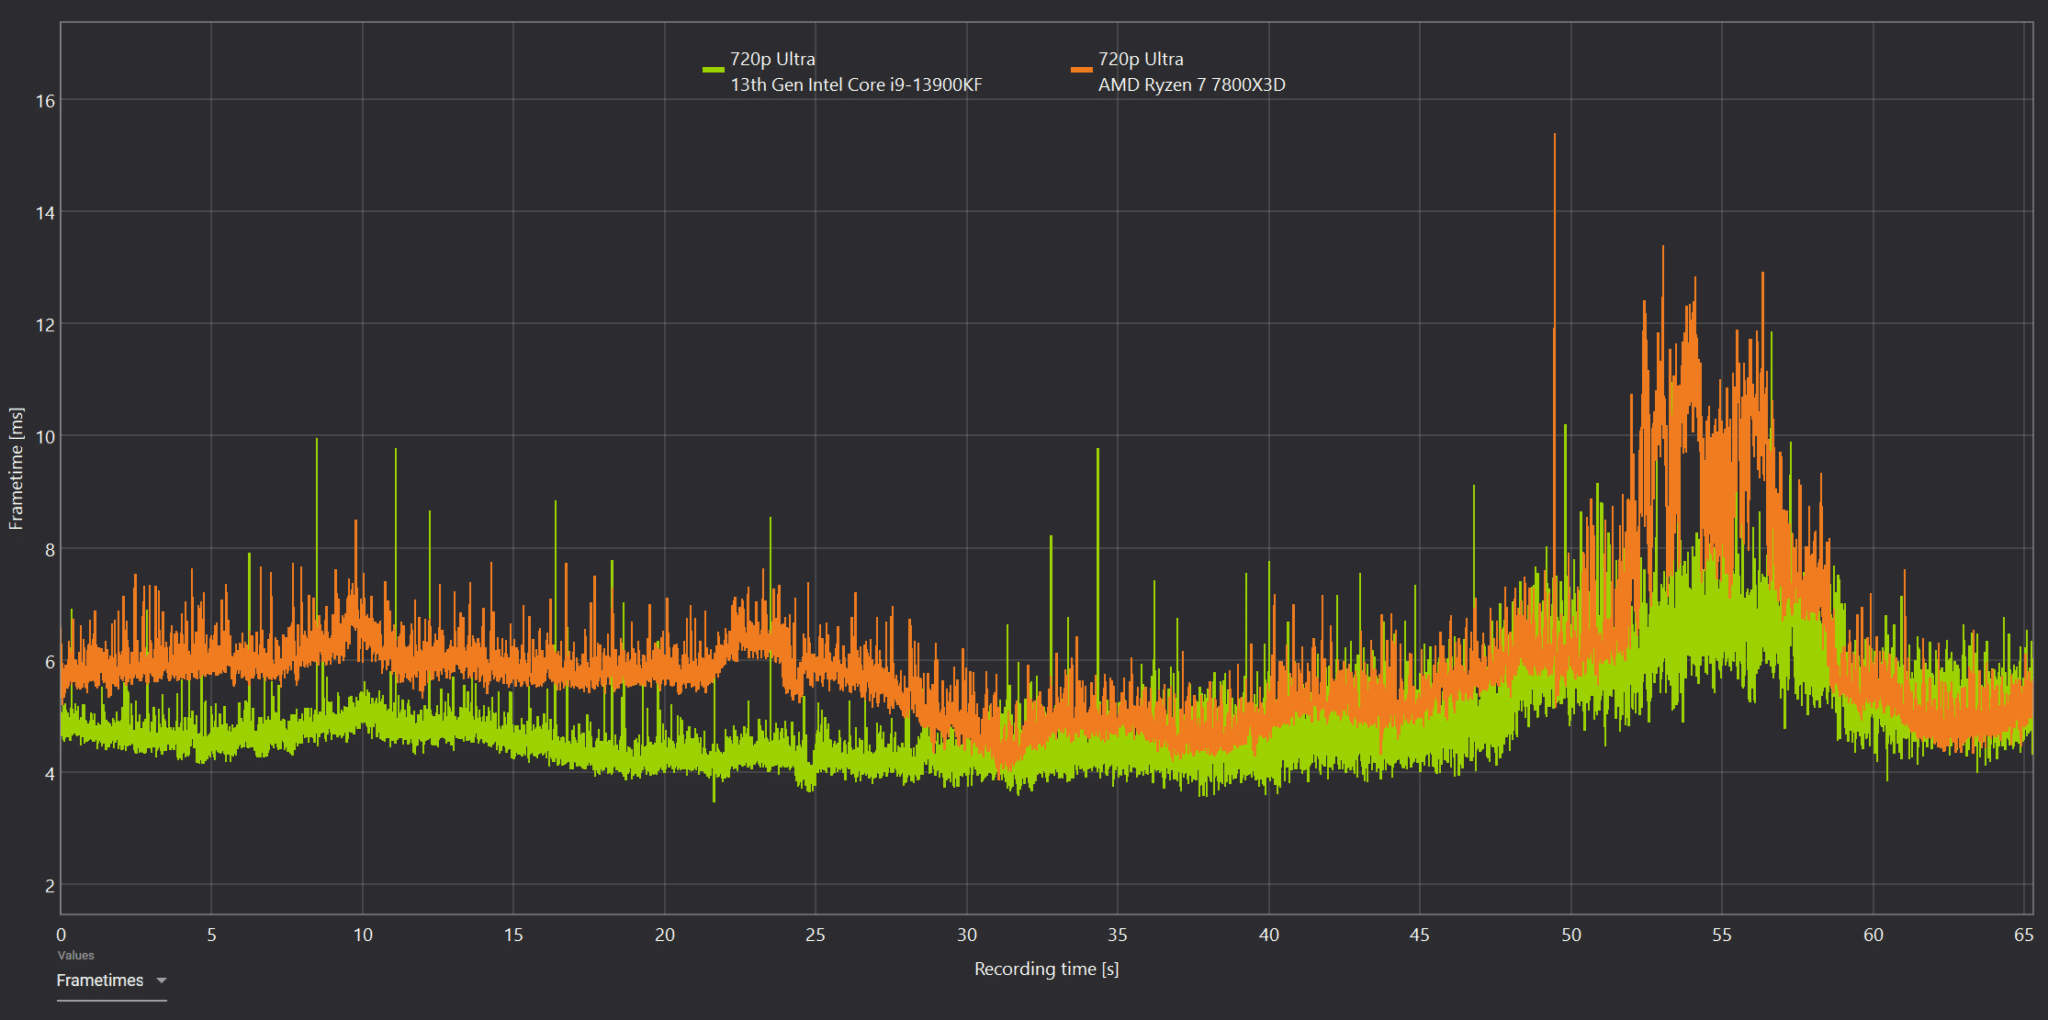
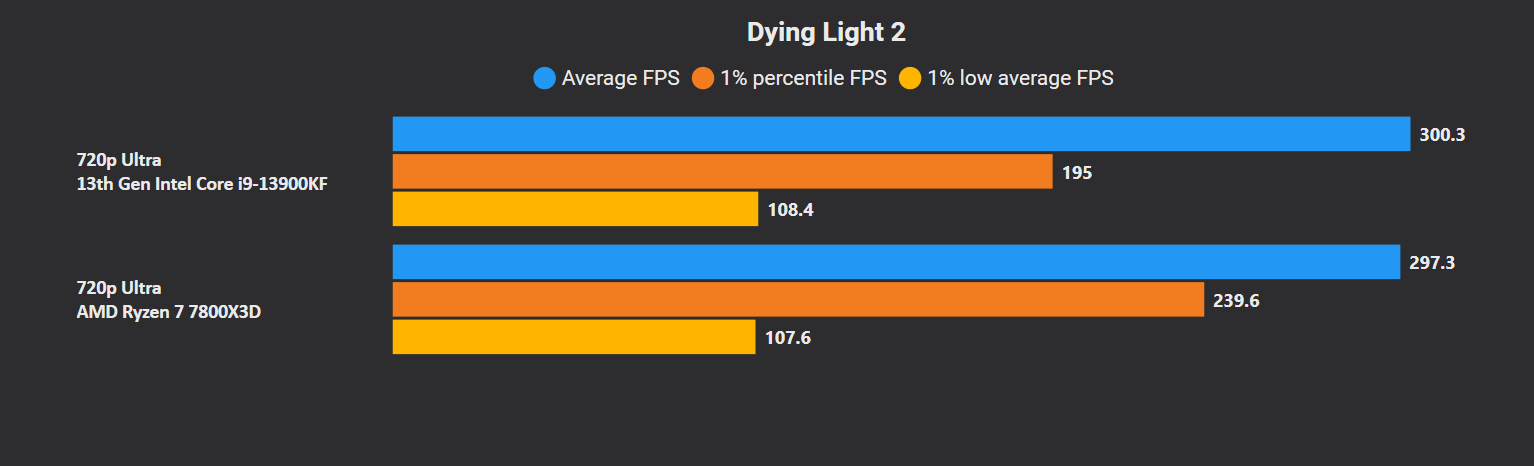
Dying Light 2 is a tie between the two processors. However, the Ryzen 7 7800X3D registers notably higher lows.

The frametime graph produces an extremely clean line for the 7800X3D with spikes that reflect the change in the scene.
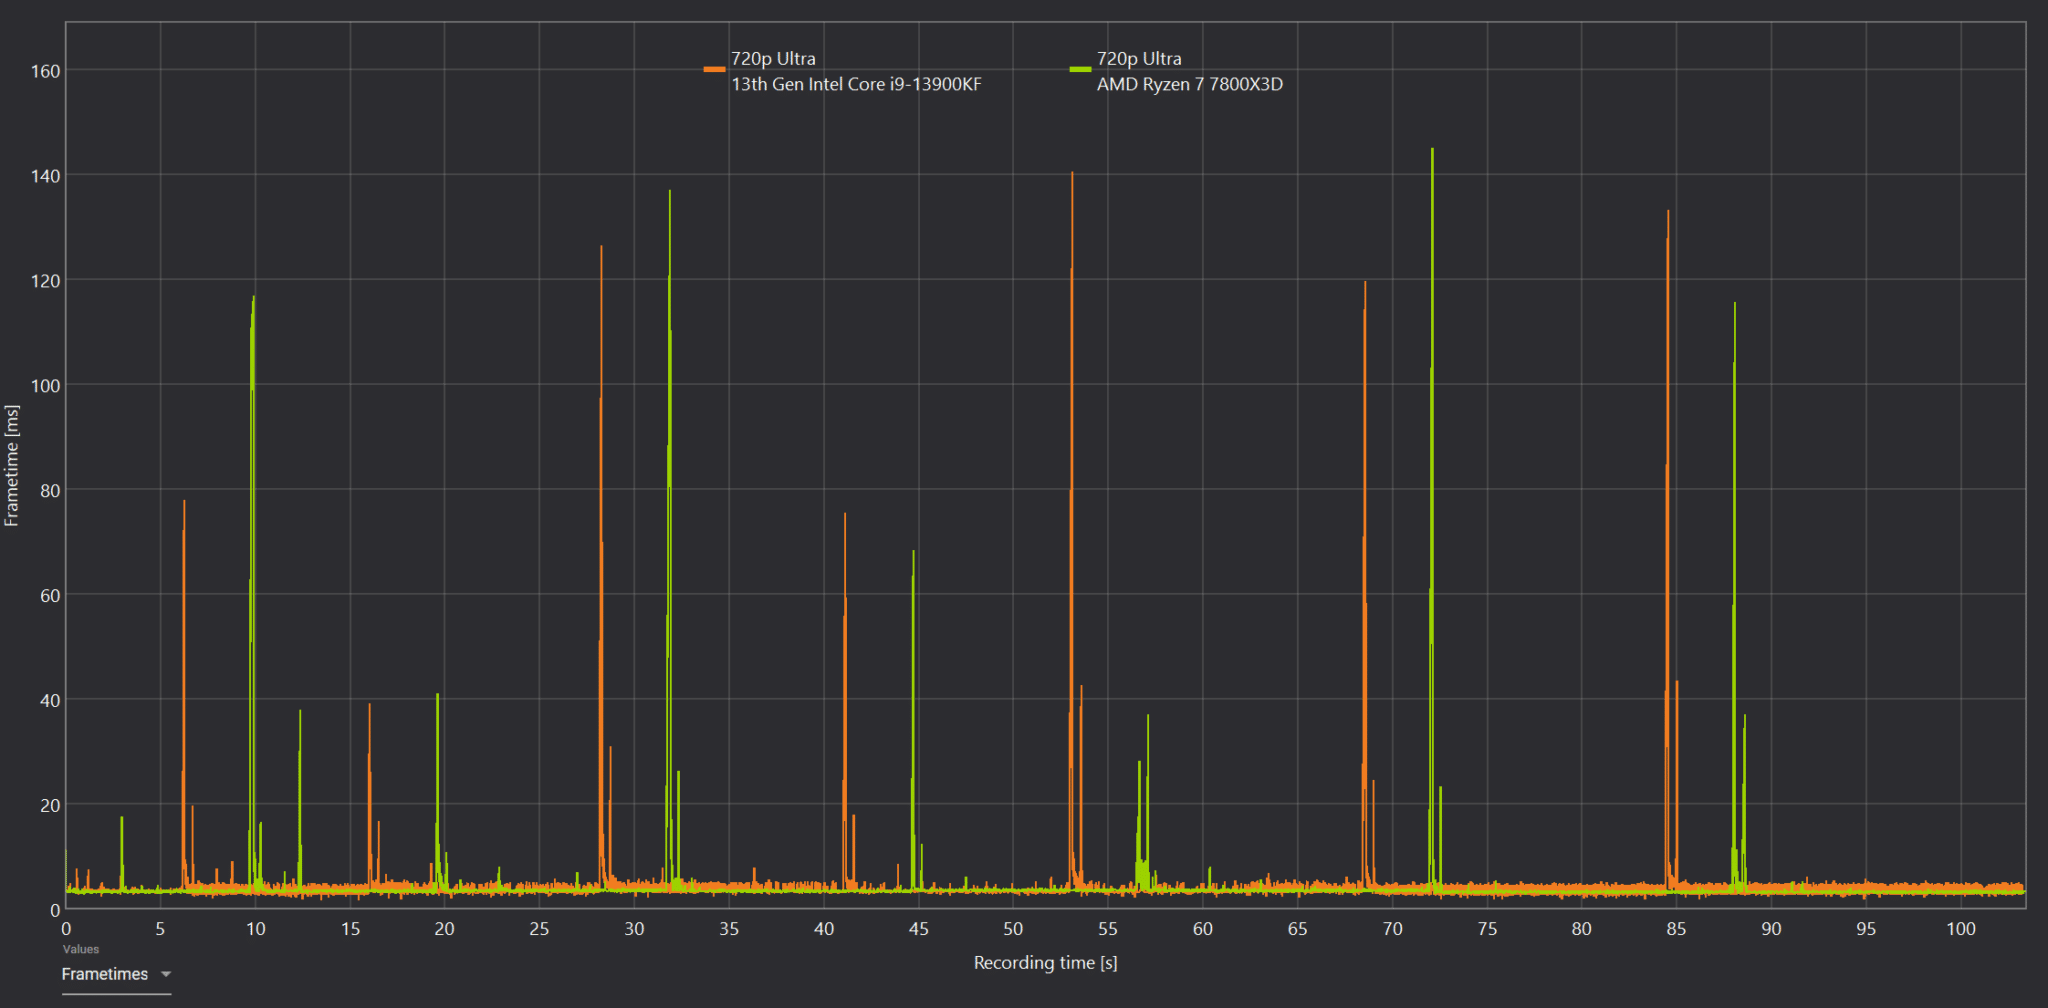
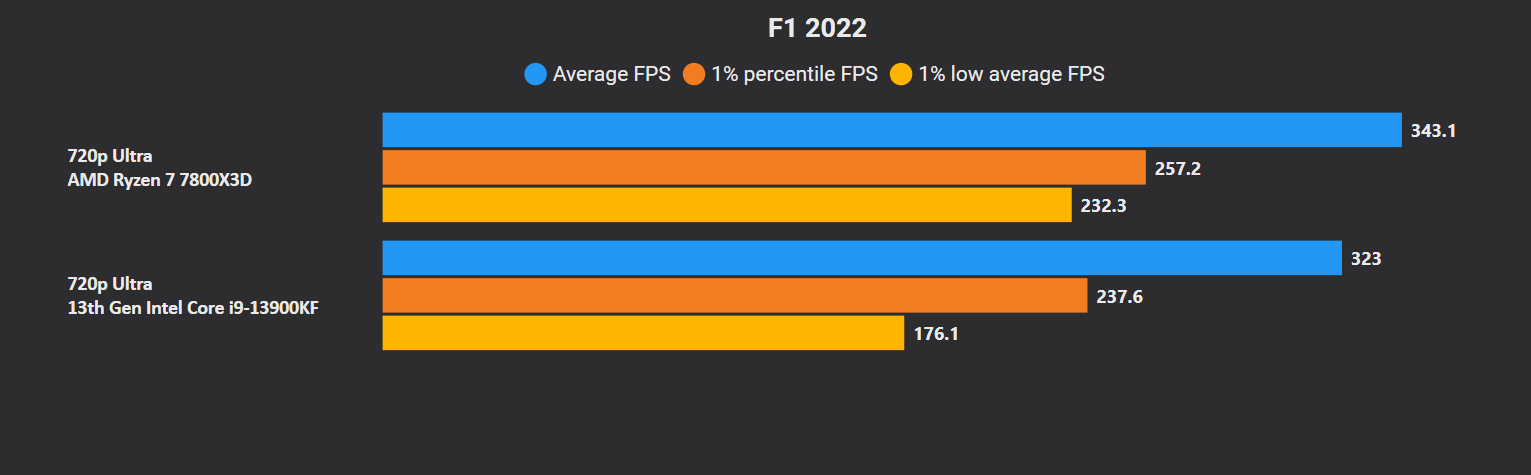
F1 2022 favors the Ryzen 7 7800X3D with a paltry 6% lead over the 13900K. The latter also exhibits a fair bit of stuttering through the course of the benchmark.

The worse lows on the Core i9 are represented by the periodic spikes on the frametime data below:
Ghostwire Tokyo marks another win for AMD. However, the Core i9-13900K offers a smoother experience in comparison.

Both the CPUs face slight micro-stuttering, but the 7800X3D is more affected by it.
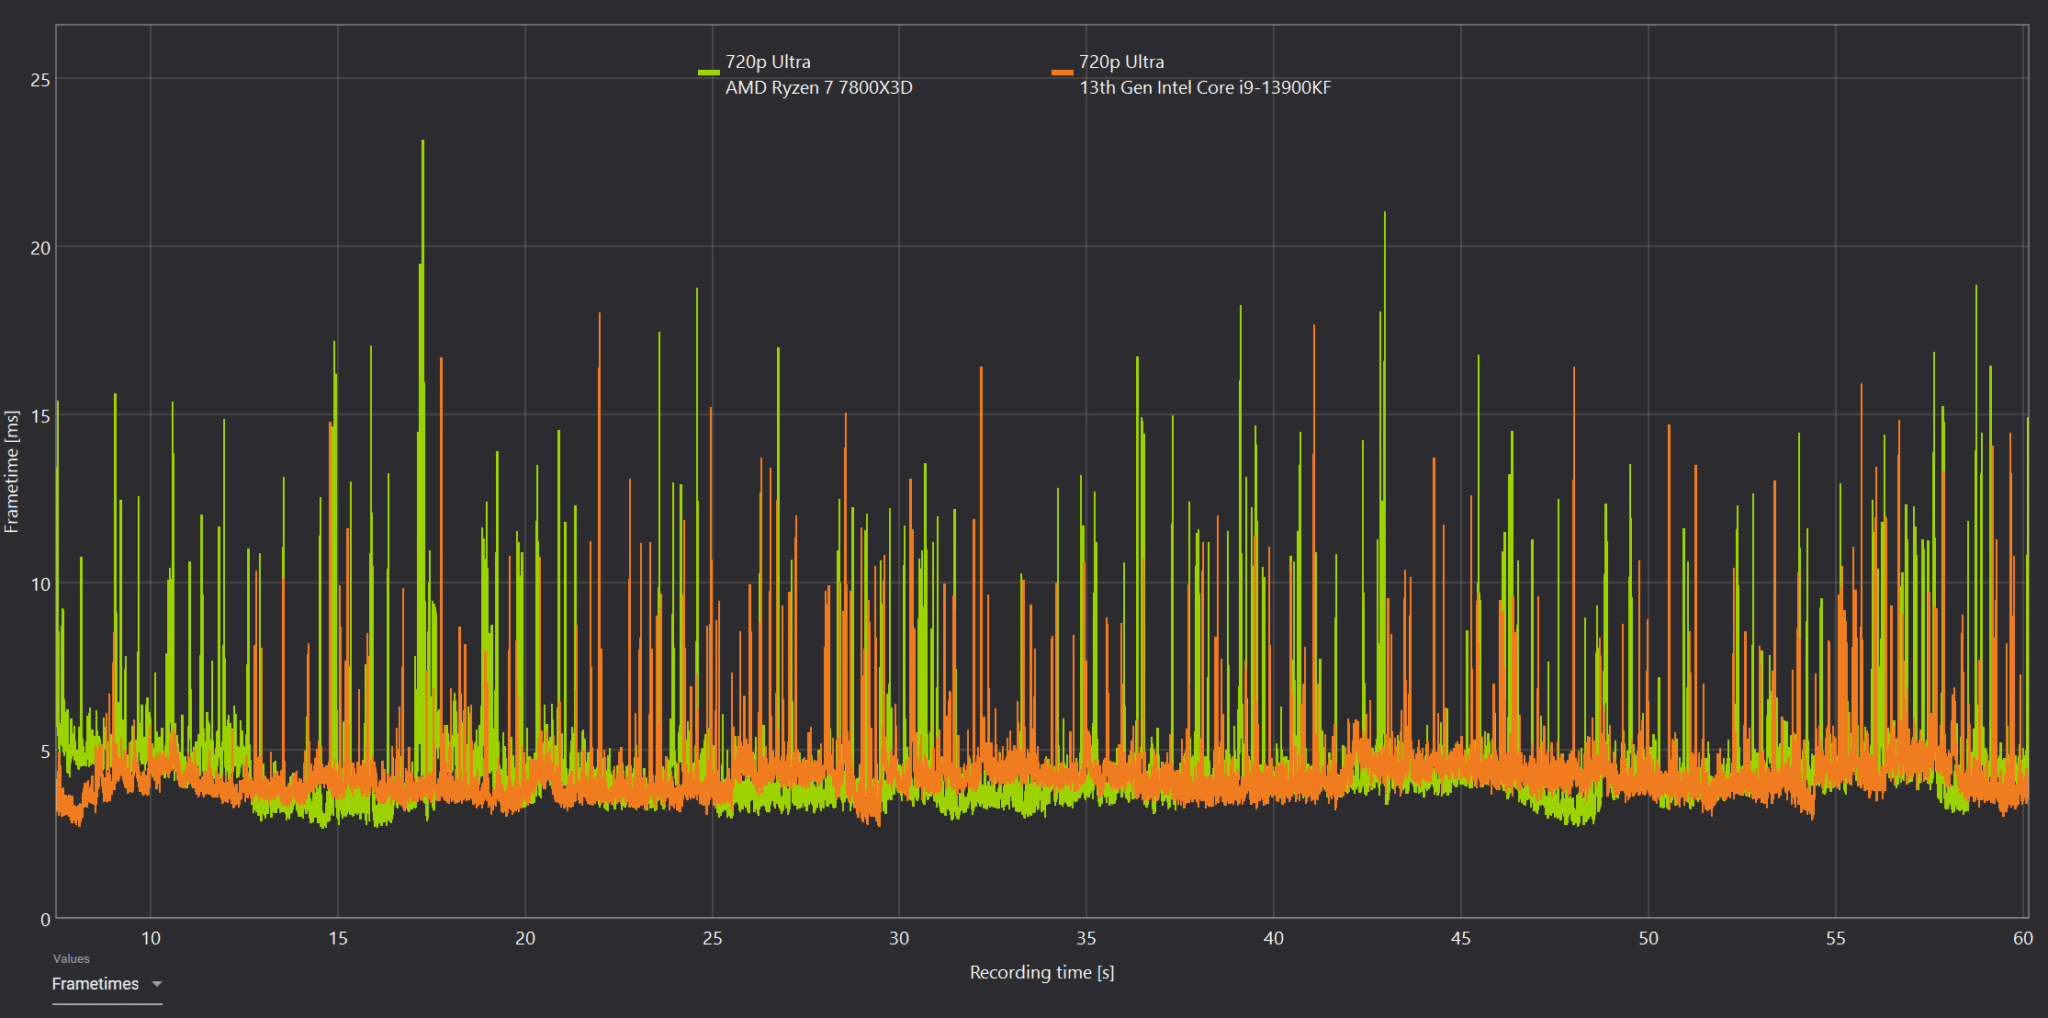
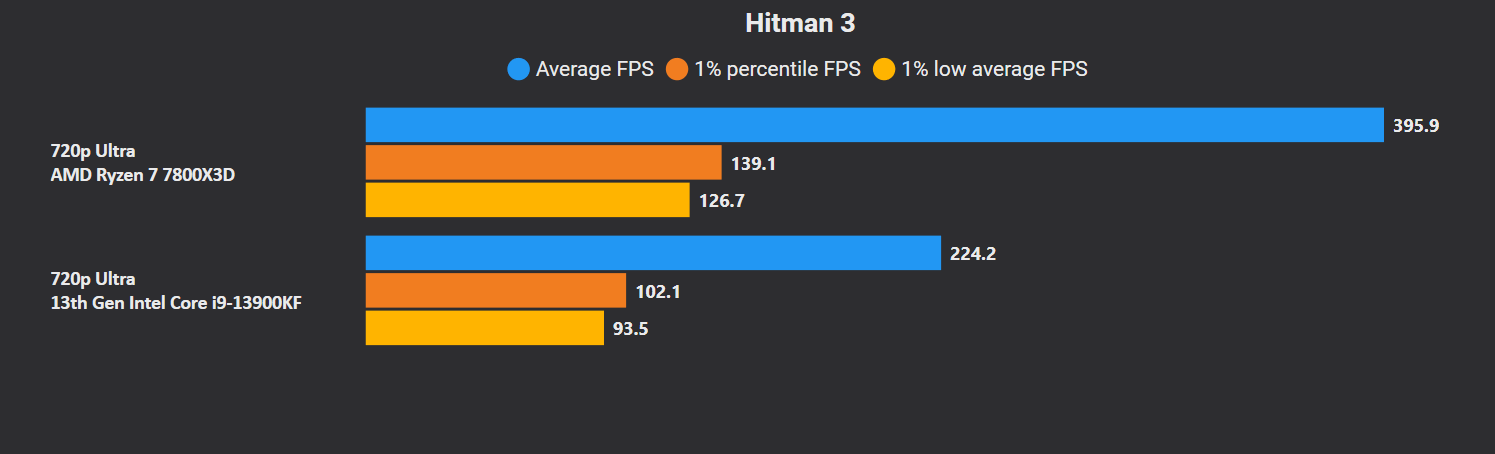
Hitman 3 is a big win for the Ryzen 7 7800X3D, with a lead of 75% on average. Even the frametime graphs look much better for the X3D while the Core i9-13900K produces a bit of a mess.

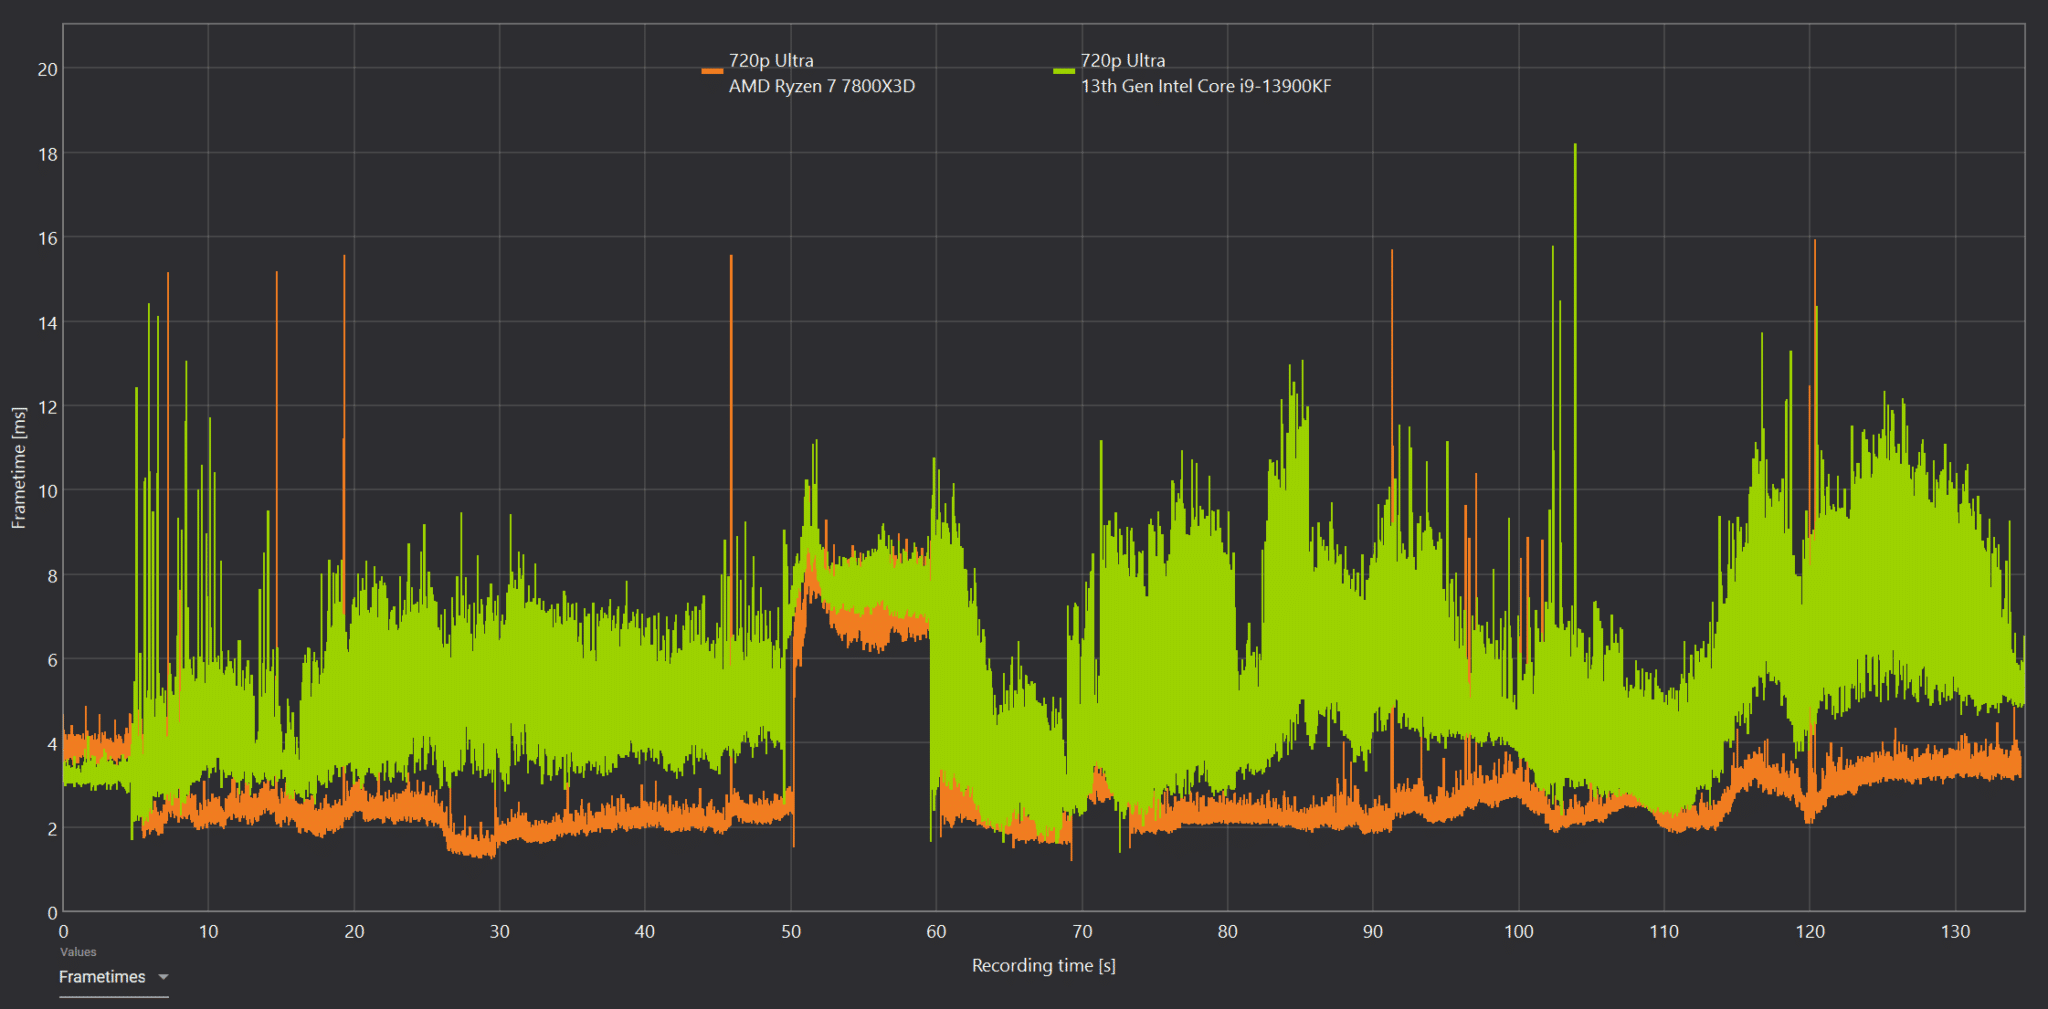
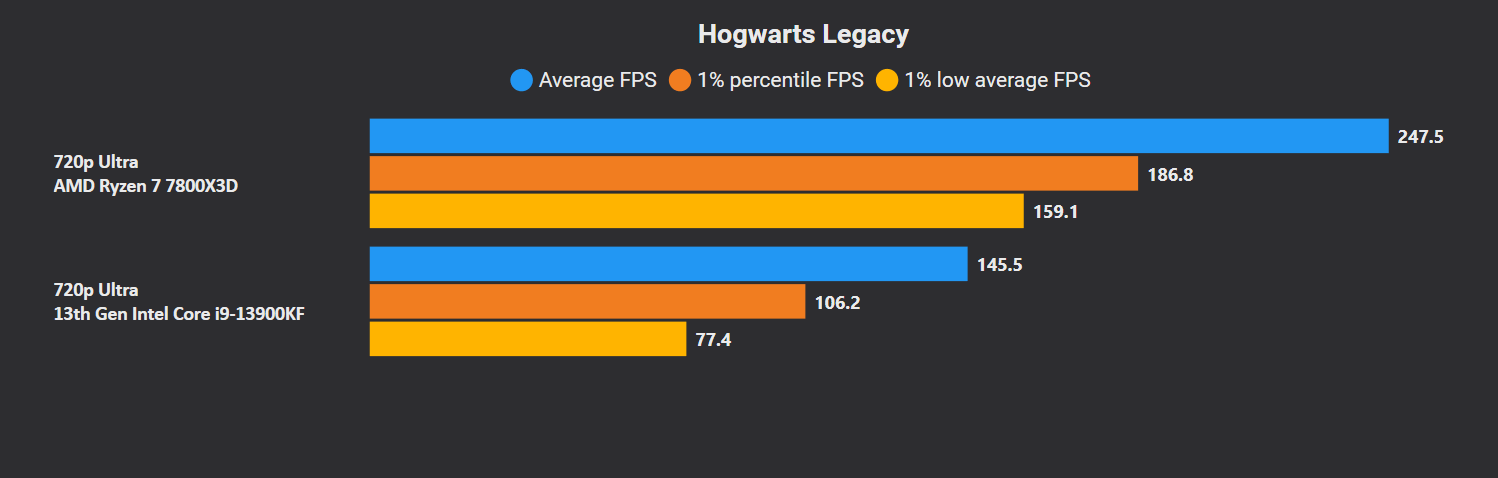
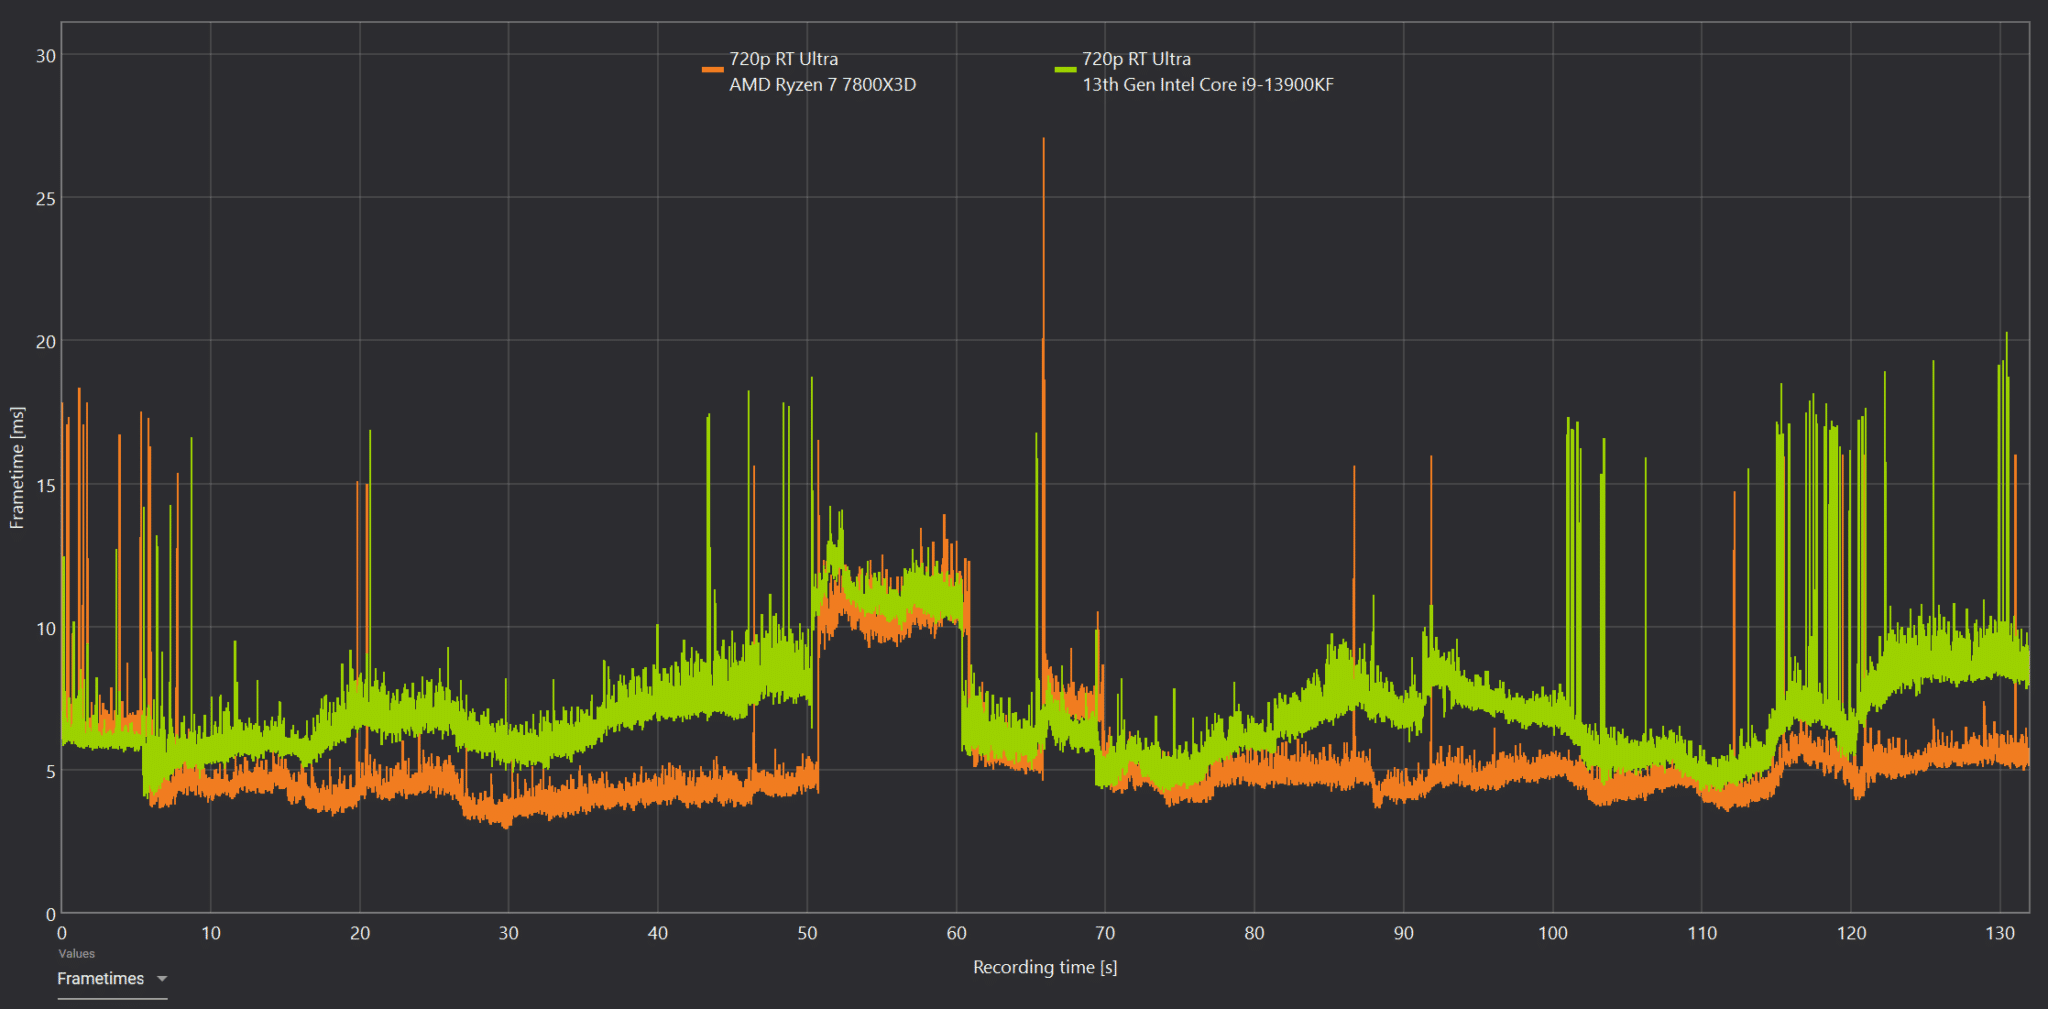
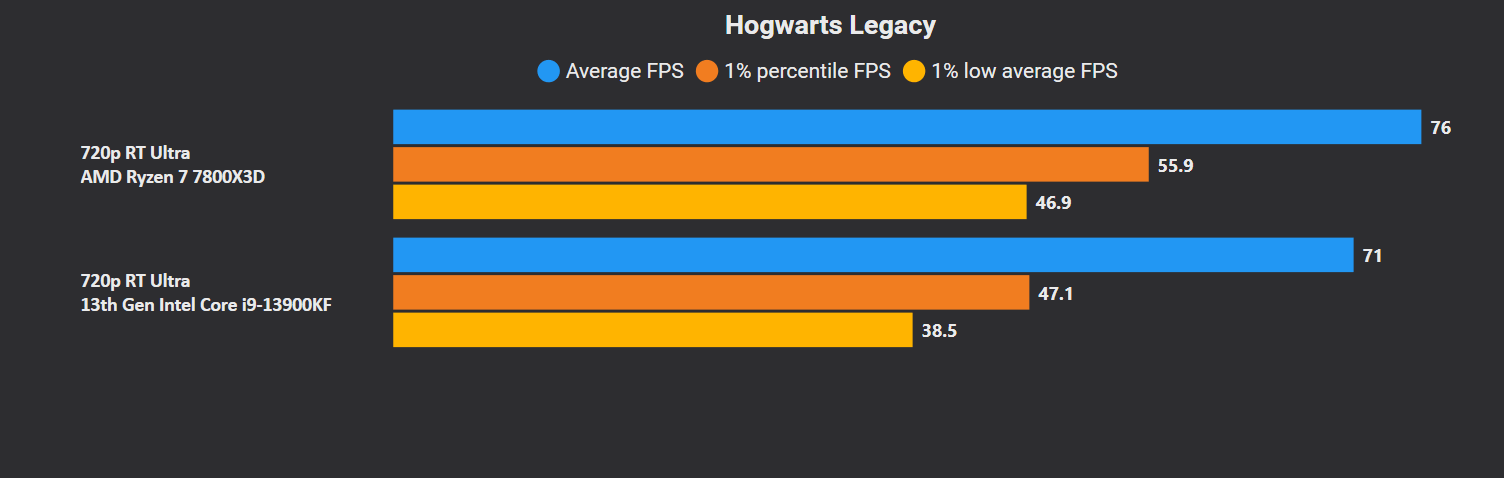
Hogwarts Legacy is another game that runs exceptionally well on the 7800X3D. We’re again looking at a 70%+ lead with notably smoother frametimes.

The frametime graph of the 7800X3D is interesting. It looks almost like there’s almost a cap keeping the frametimes limited to 5ms. In comparison, the 13900K faces a fair number of spikes.
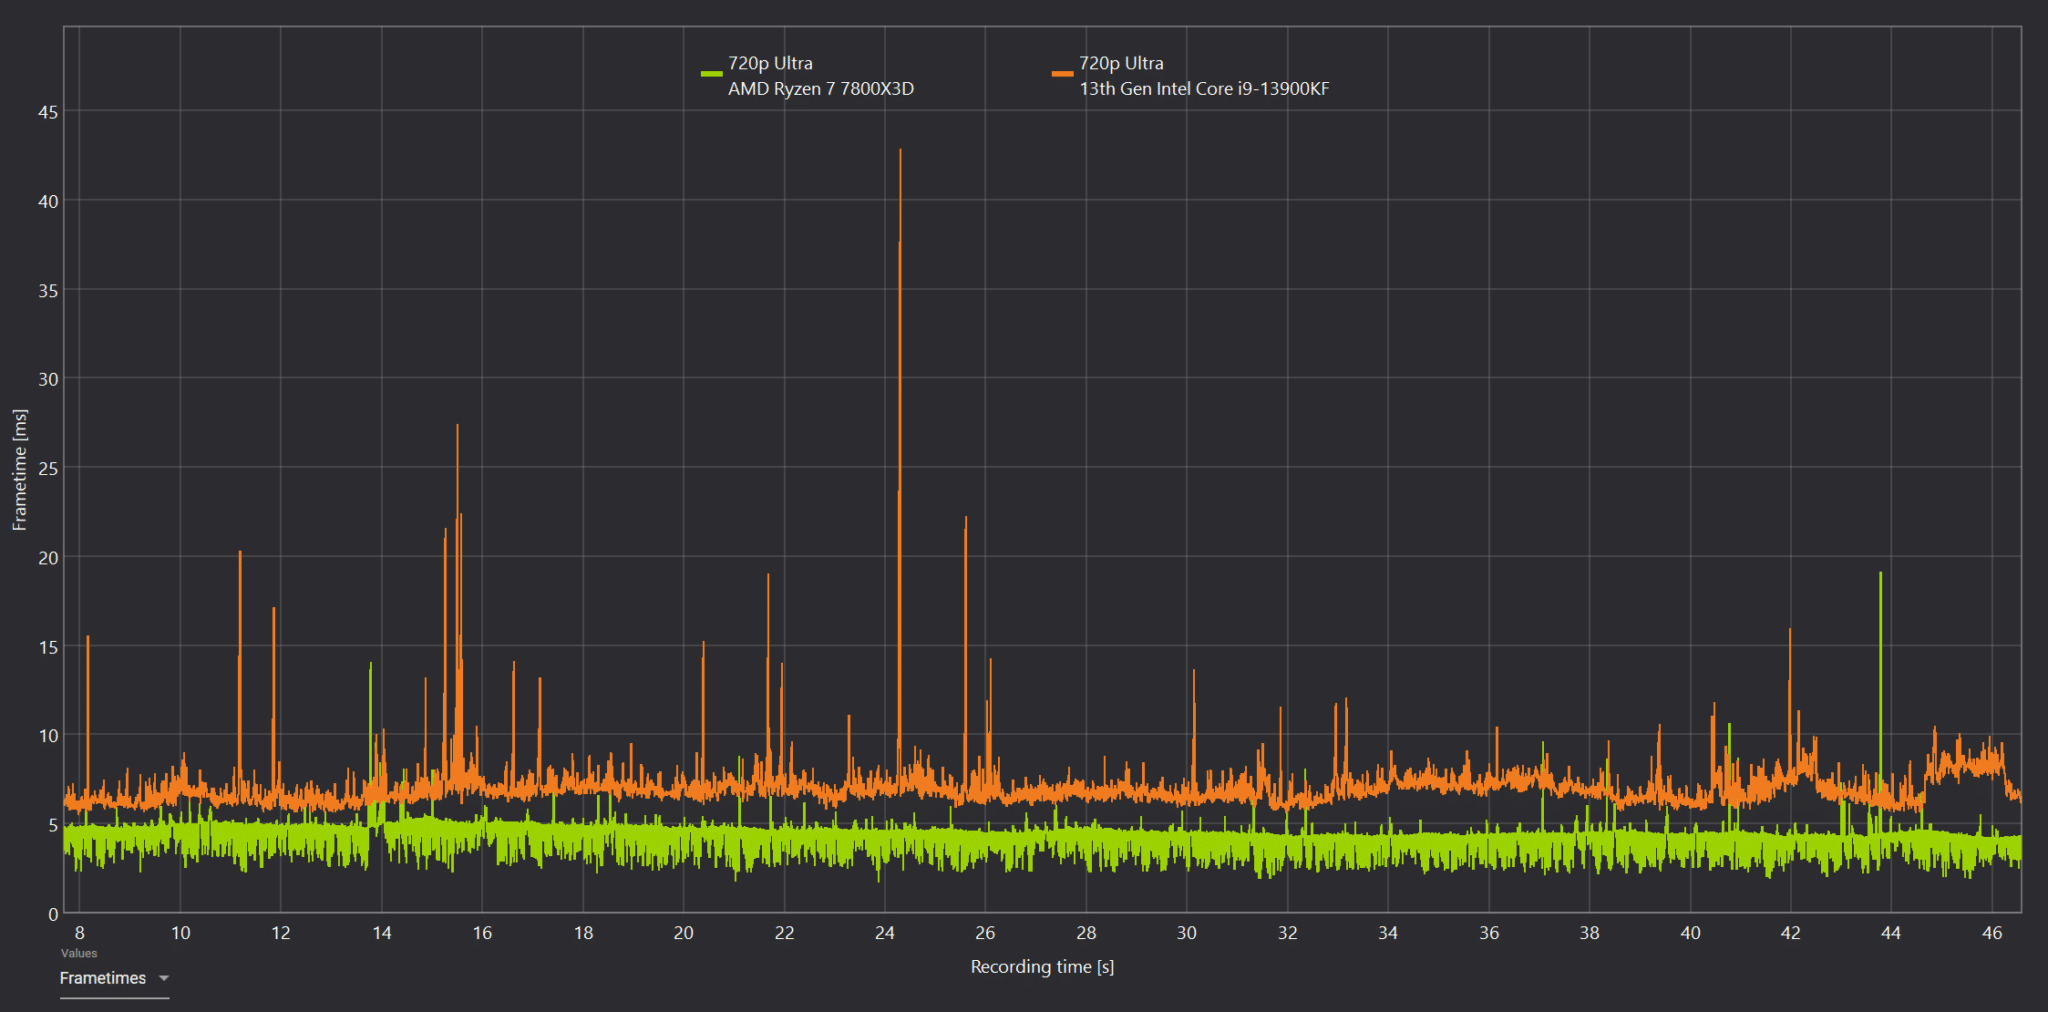
Shadow of the Tomb Raider goes the V-Cache way, with a 49% lead over the Core i9-13900K. The lows don’t look any good either for the Core i9 either.

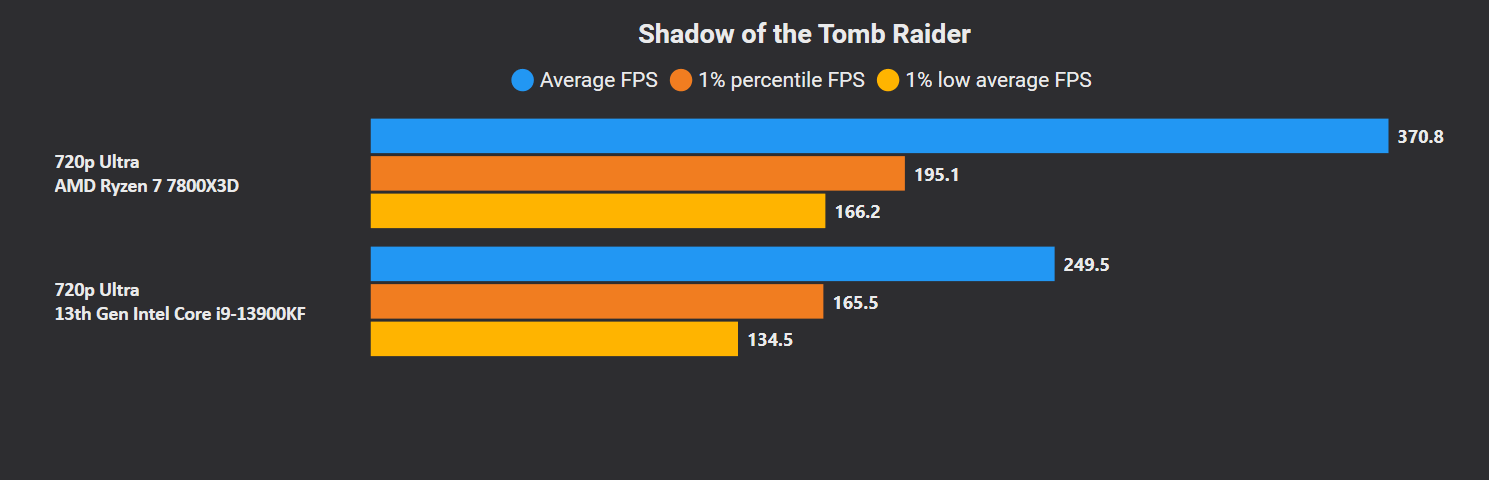
However, a look at the frametime graph reveals more consistent frame-pacing for the Intel part.
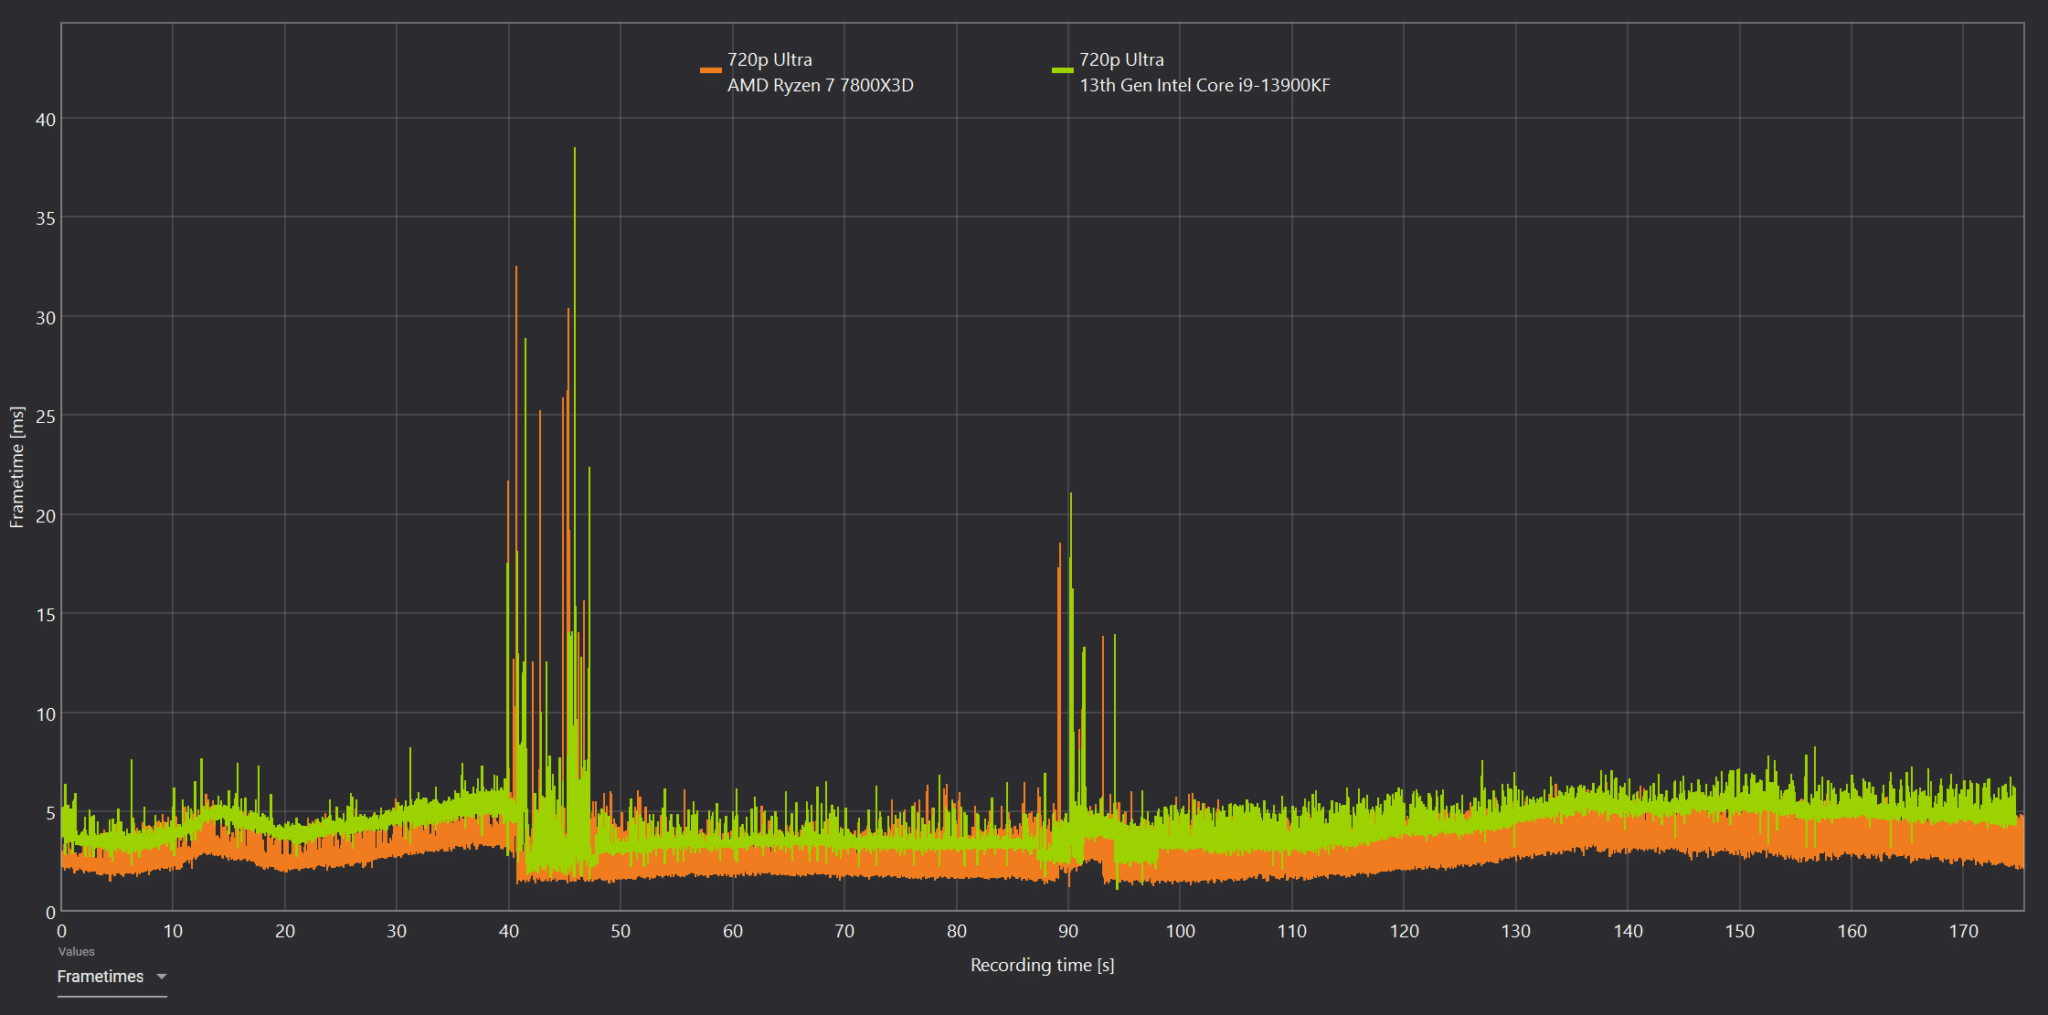
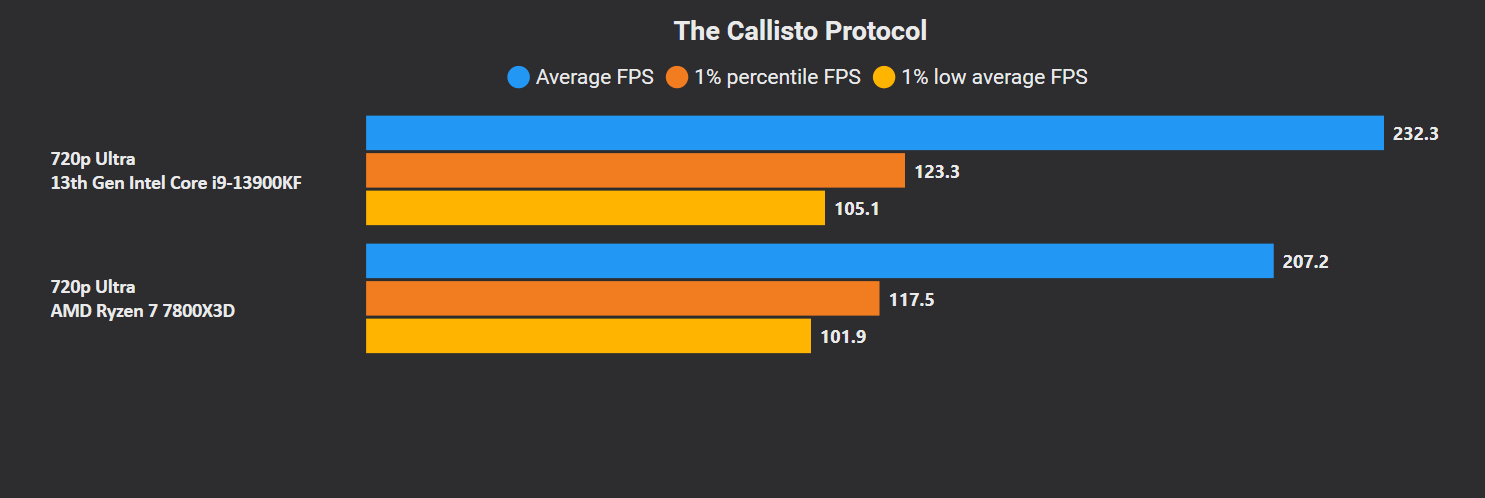
The Callisto Protocol is an AMD partner title, and yet the Core i9-13900K manages a strong win with similar lows. The frametime graphs of the two CPUs are almost identical.

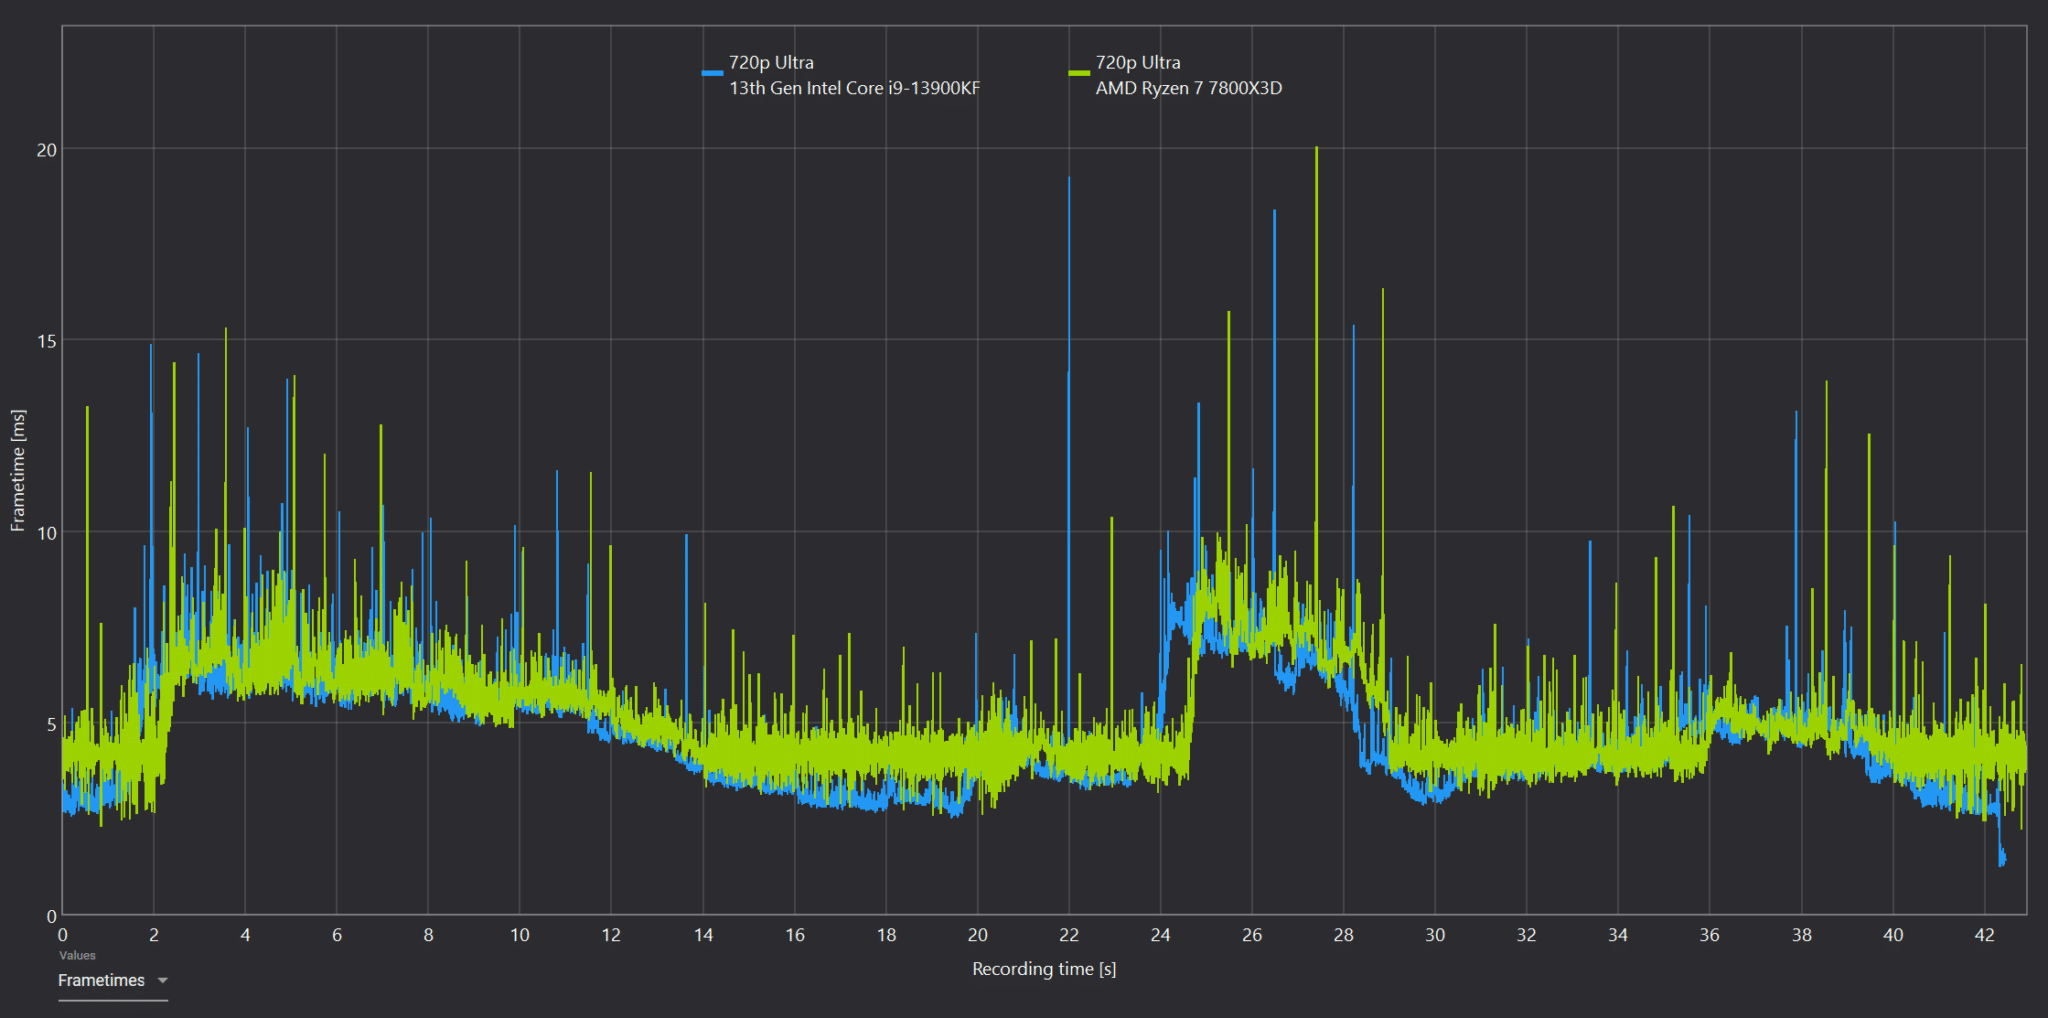
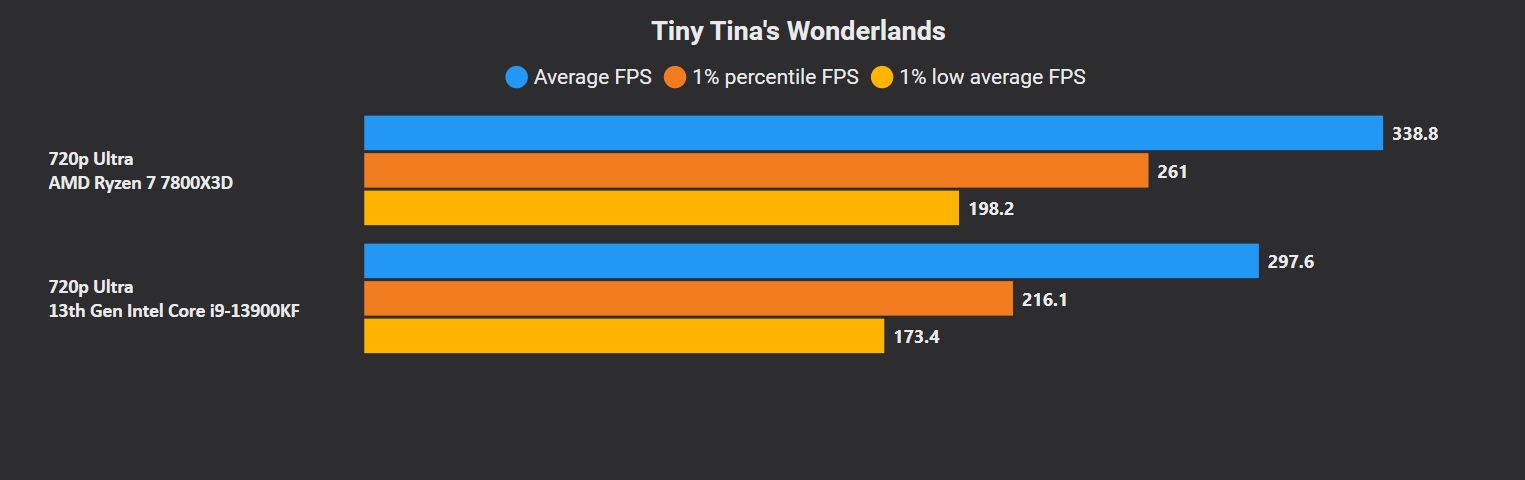
Tiny Tina’s Wonderlands is the final rasterized benchmark, and it also runs better on the Ryzen 7 7800X3D. The 13900K is a bit over 10% slower than the Ryzen with notably worse lows and a messy frametime graph.

Overall, that’s seven wins for the Ryzen 7 7800X3D and four for the Core i9-13900K in rasterization. Onto ray-tracing now.
Ray Tracing Benchmarks on the Next Page…
AMD Ryzen 7 7800X3D vs Intel Core i9-13900K Gaming Benchmarks
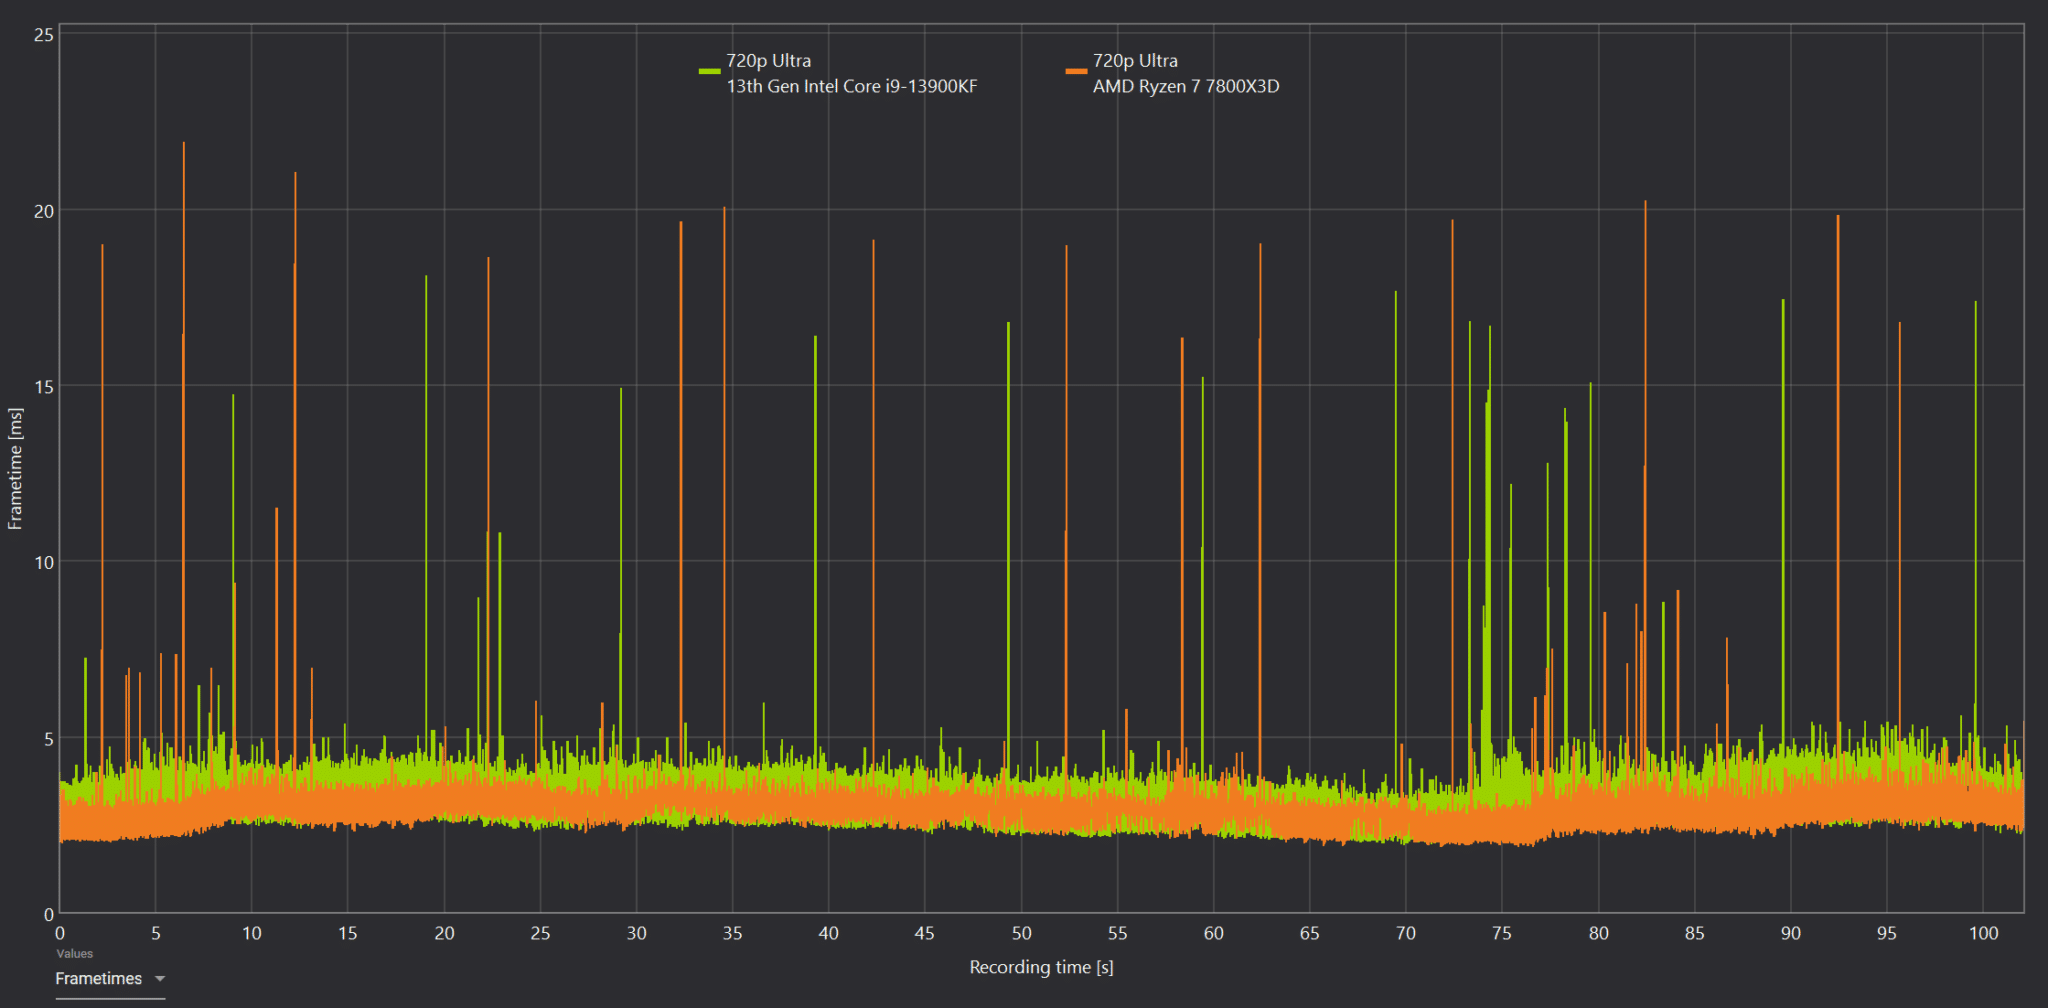
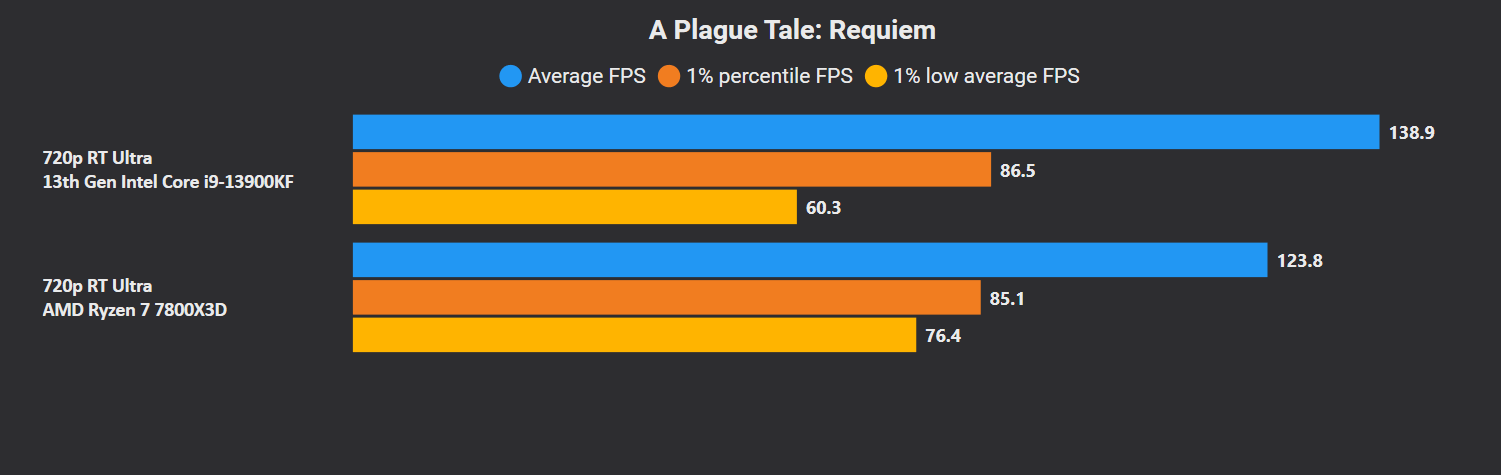
The Intel Core i9-13900K starts off strong with two consecutive wins in ray-tracing. In Plague, the lows are nearly identical on the two CPUs with a cleaner frametime graph for the Ryzen 7 7800X3D.

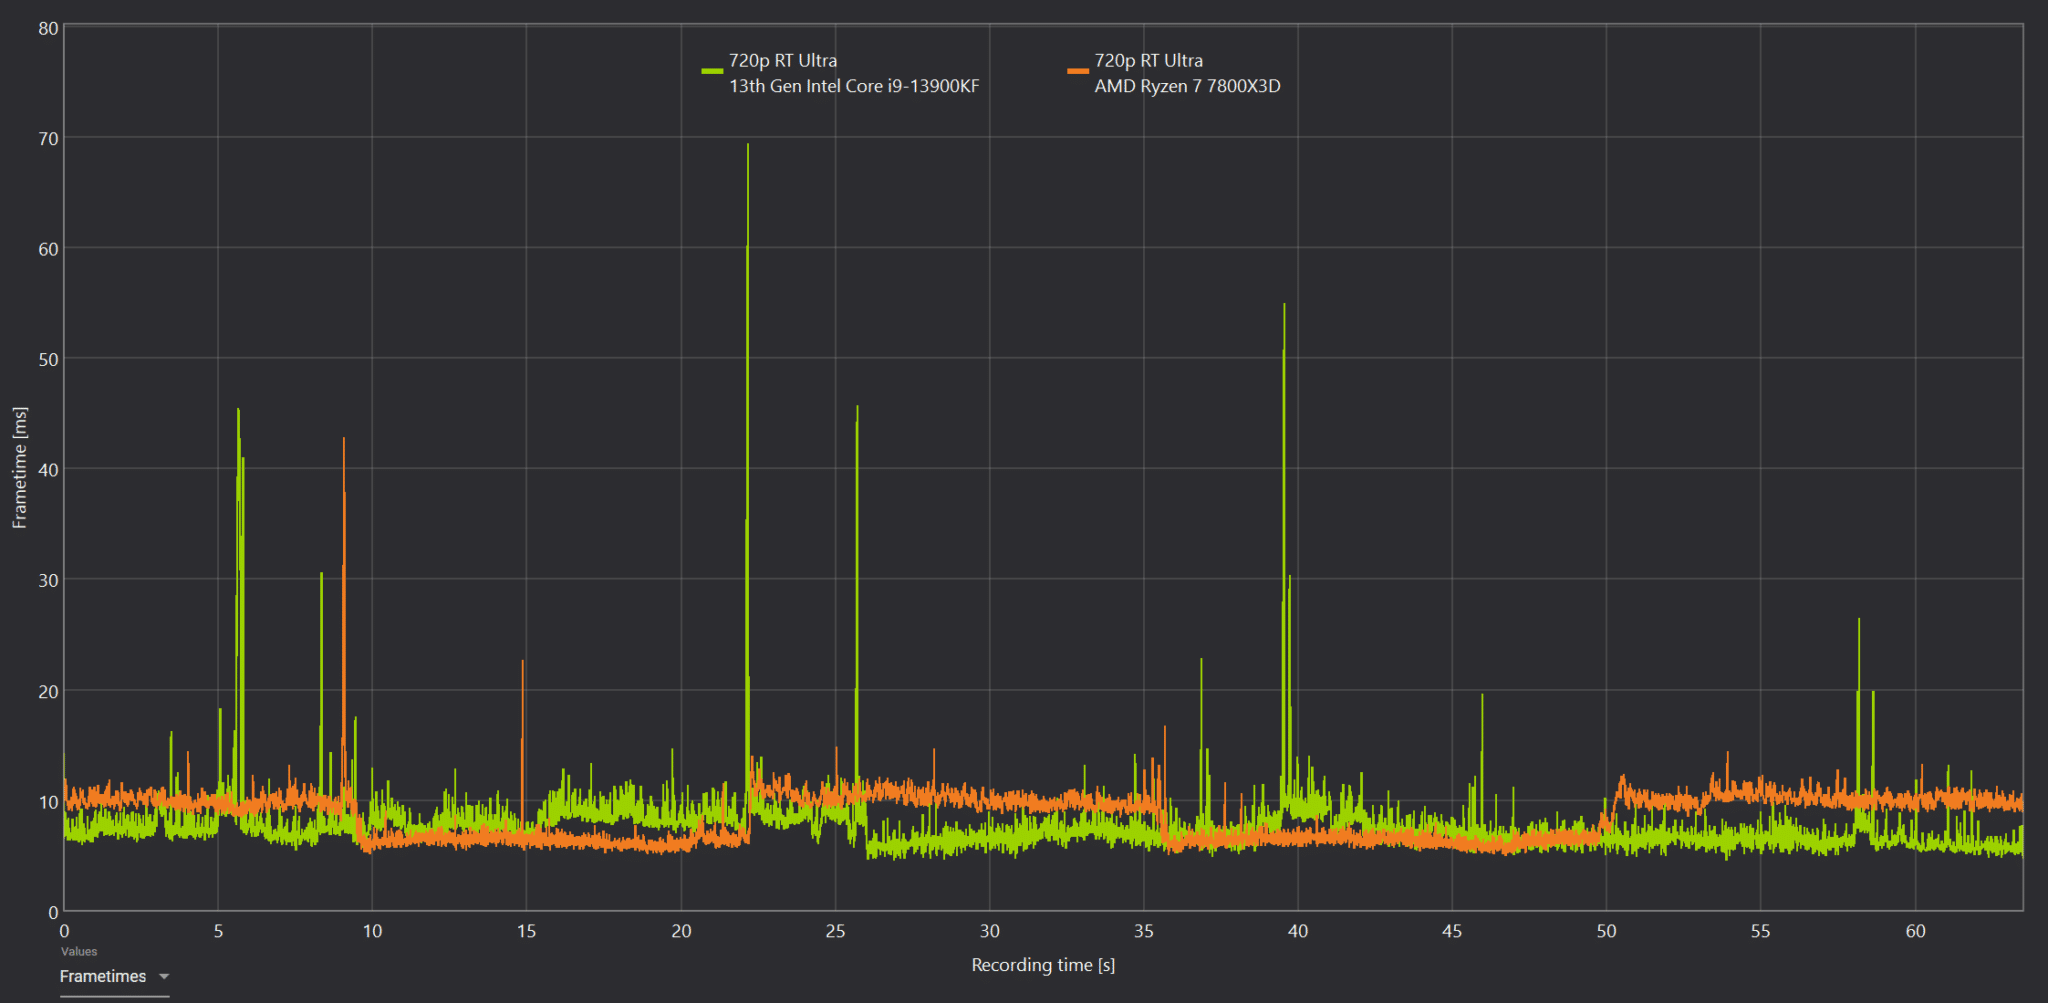
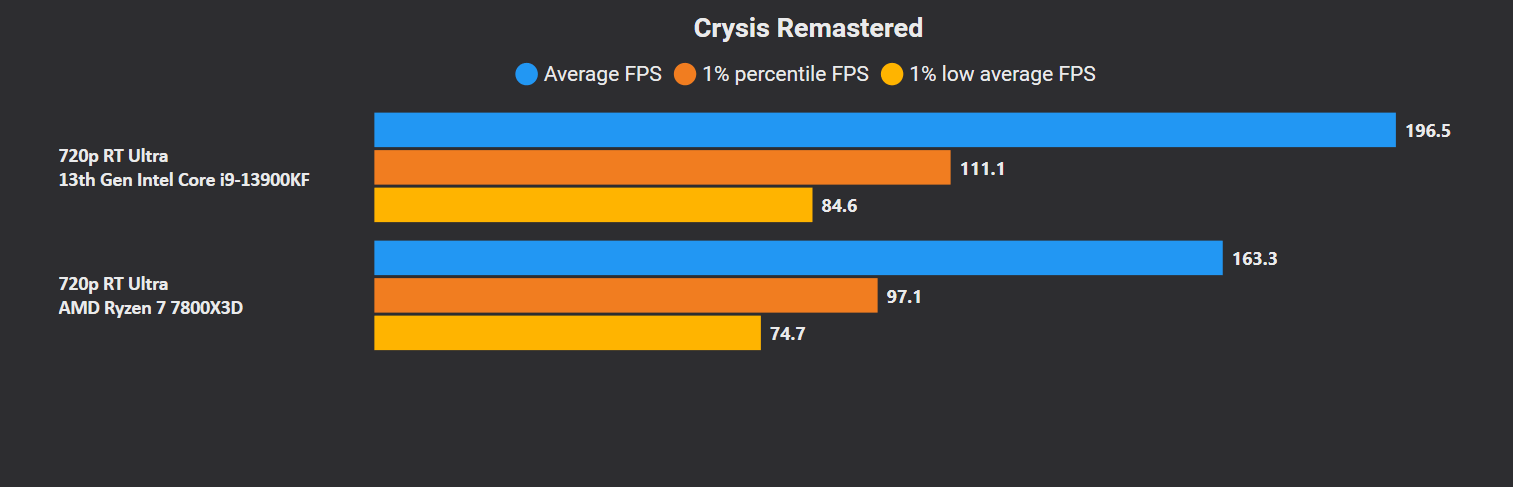
Crysis Remastered favors the 13900K with similar lows on the two processors. Both chips faced one steep spike while the rest of the test went smoothly.

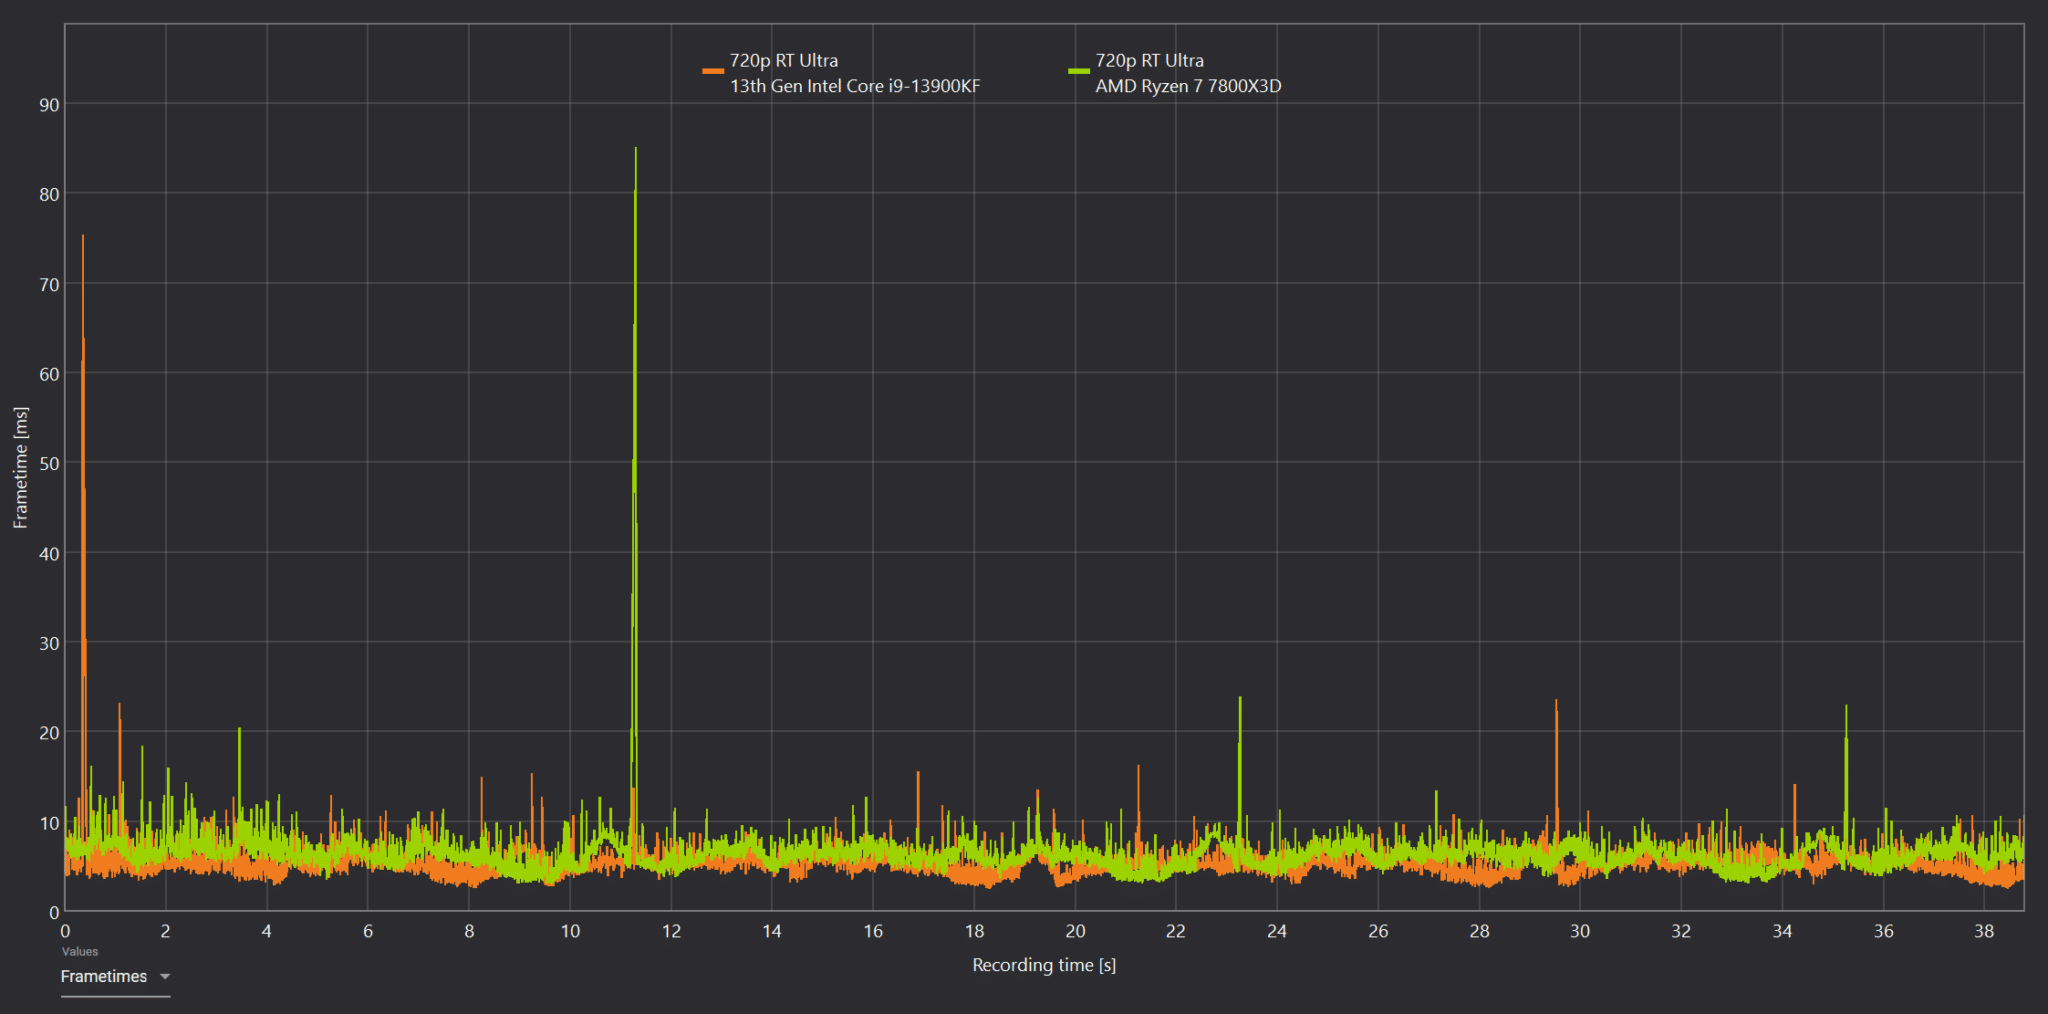
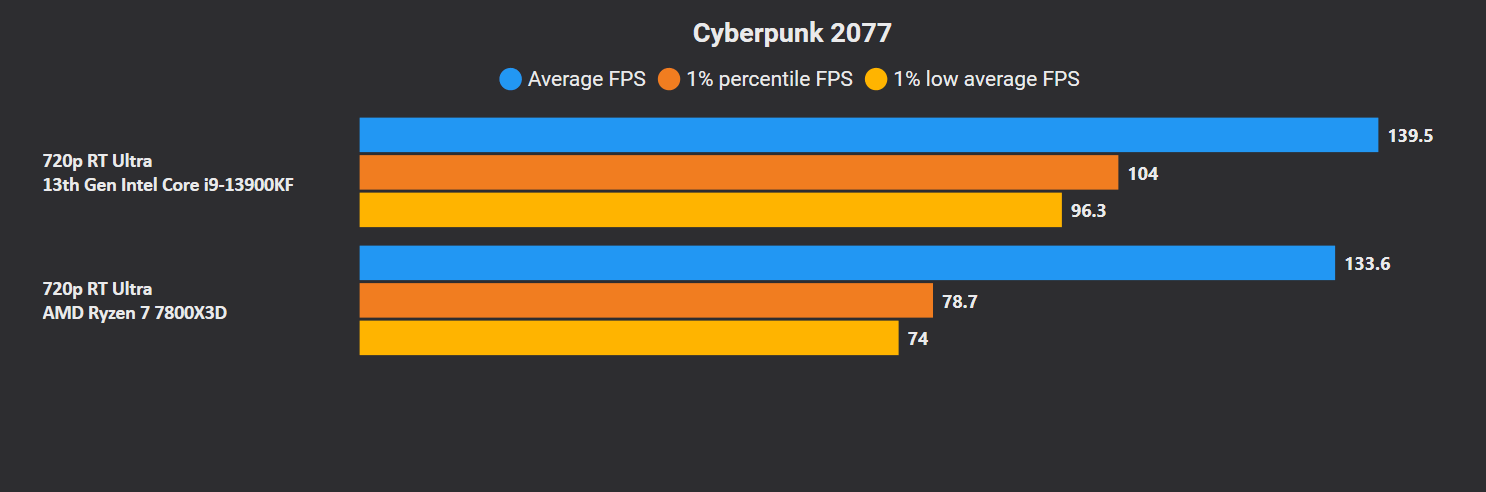
Cyberpunk 2077 also goes Intel’s way with a subtle but consistent lead that stretches to the lows.

The 7800X3D runs well for the most part but is undone by a stutter patch in the last section of the benchmark.
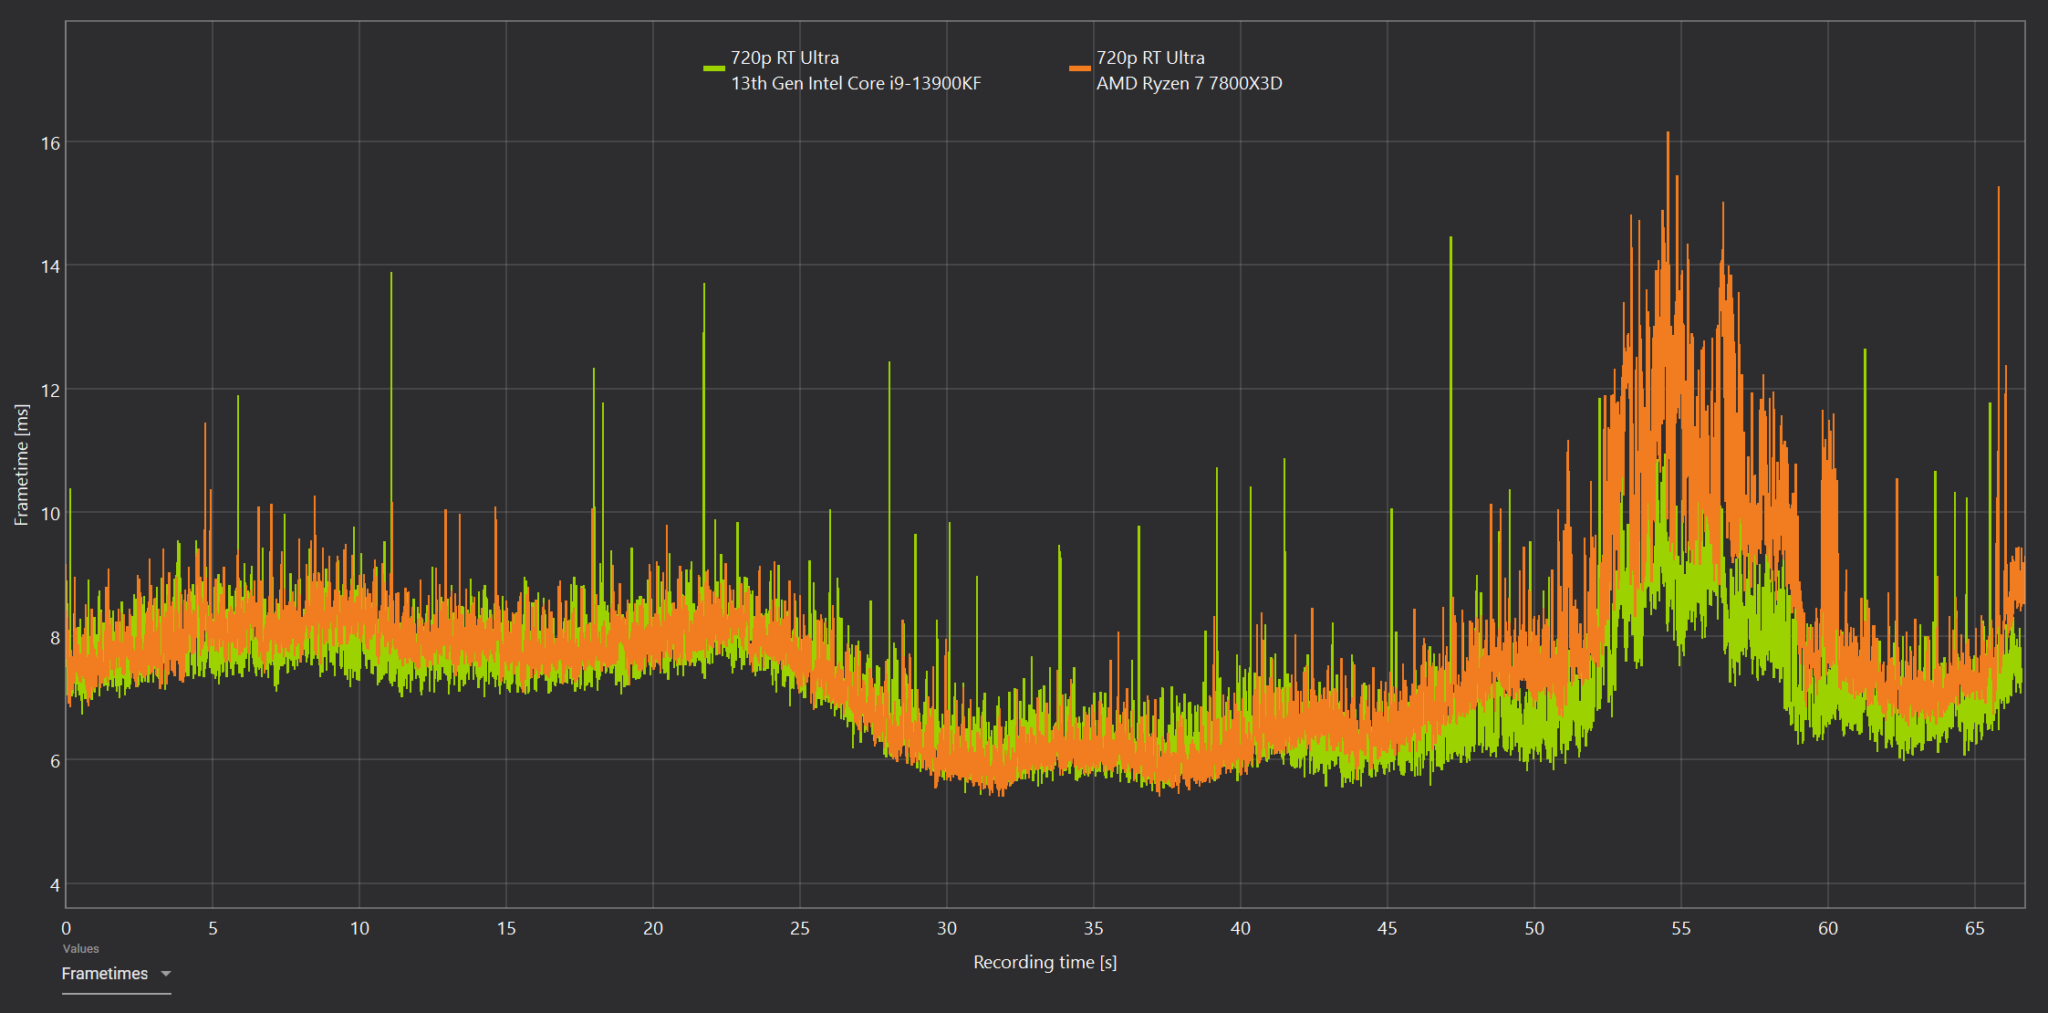
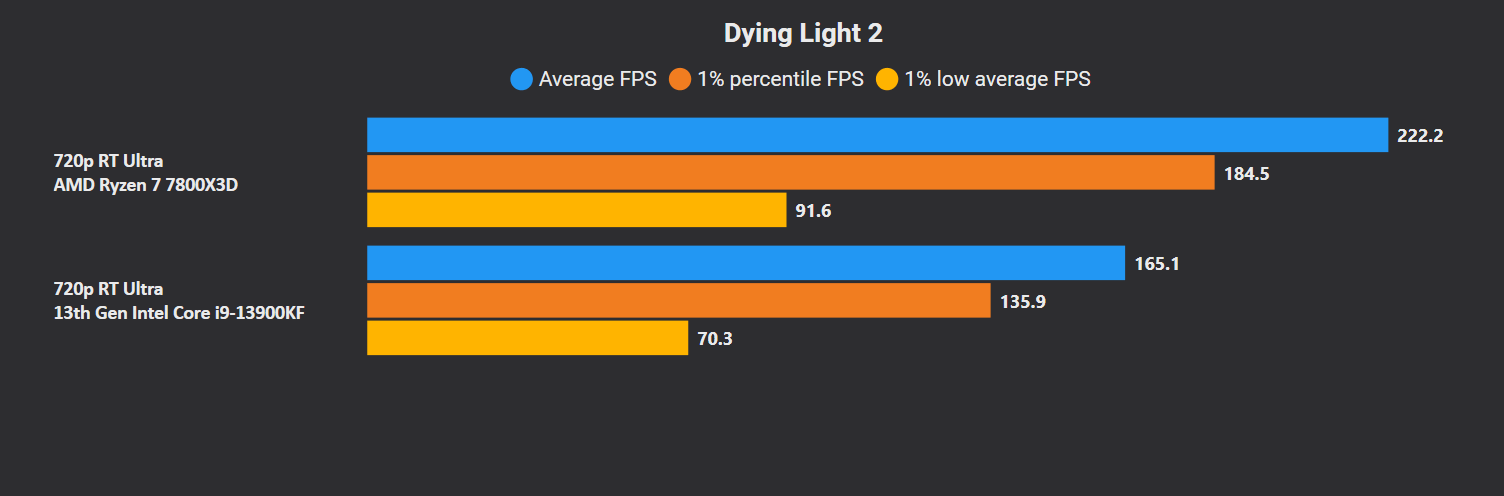
Dying Light 2 is the first win for the Ryzen 7 7800X3D in ray-tracing, and it’s a big one. The averages and lows are both significantly higher on the X3D.

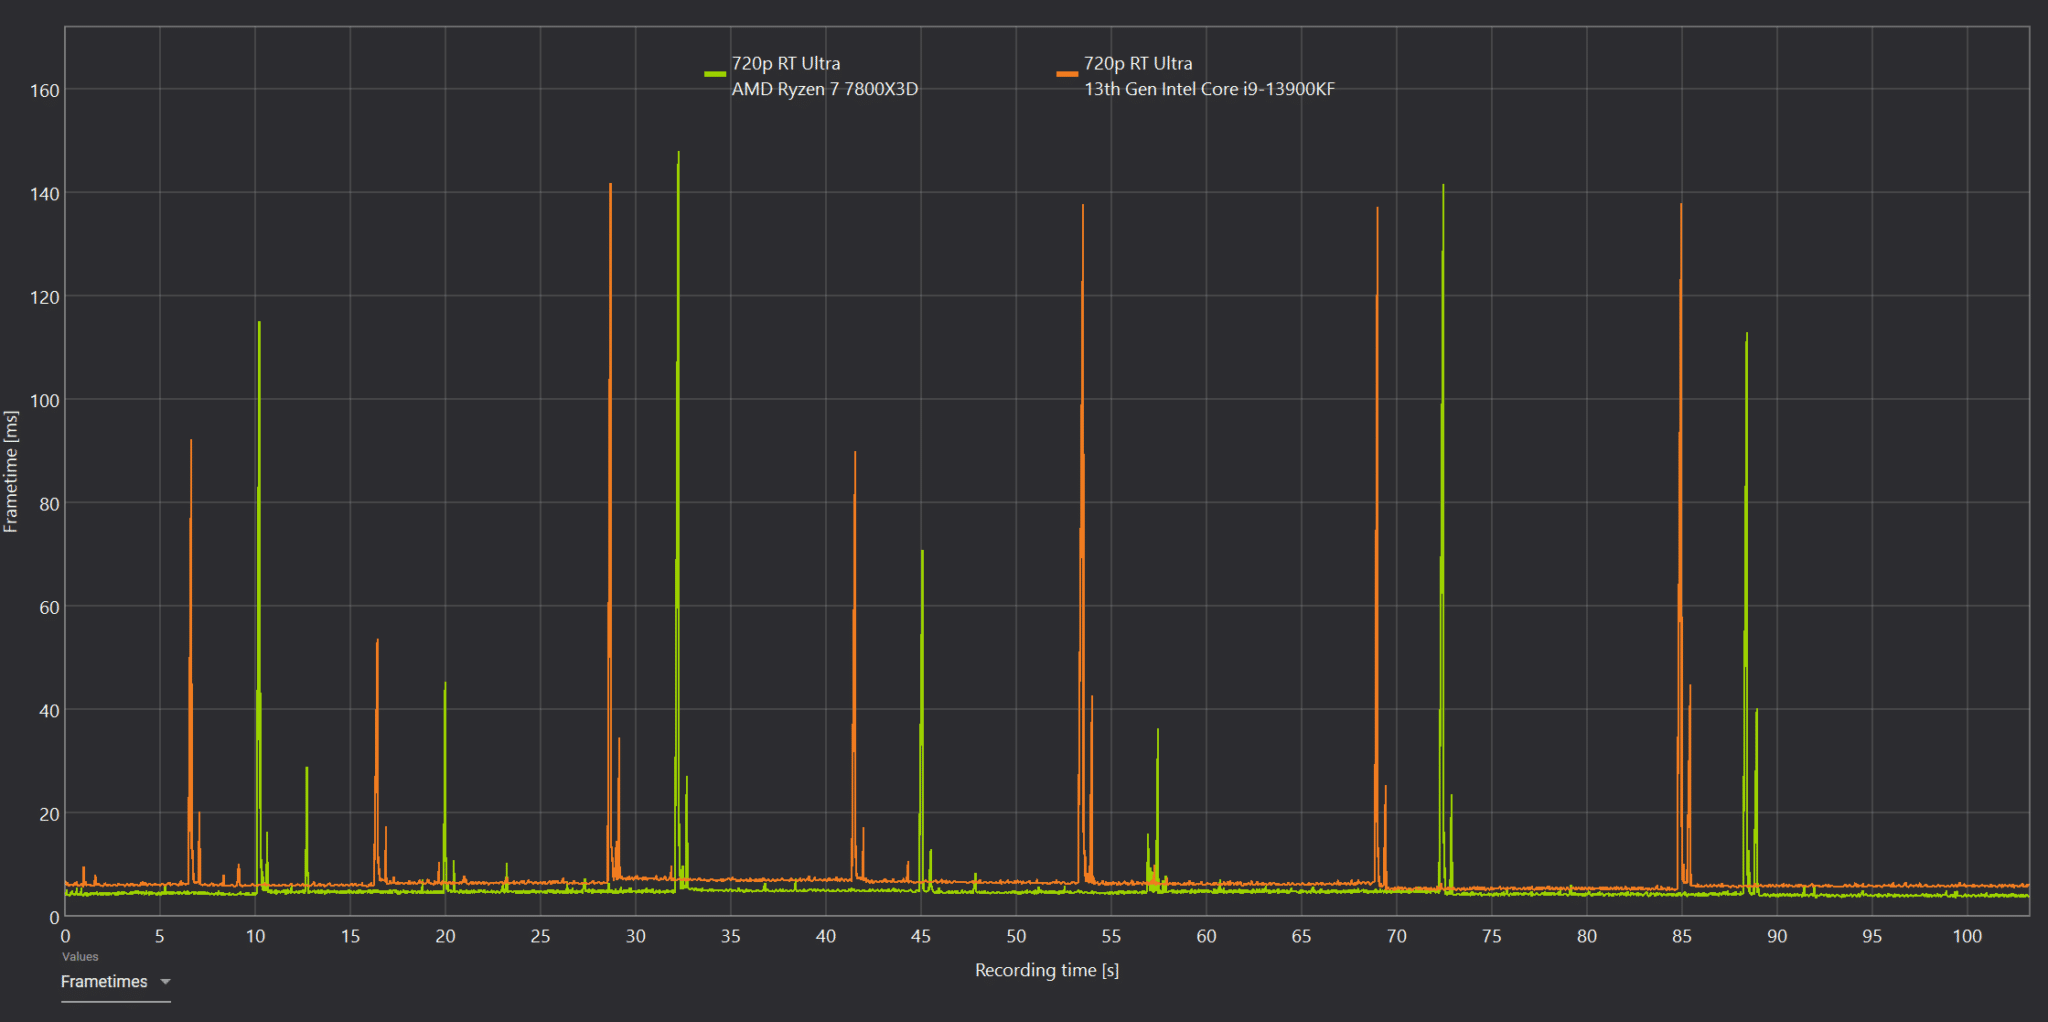
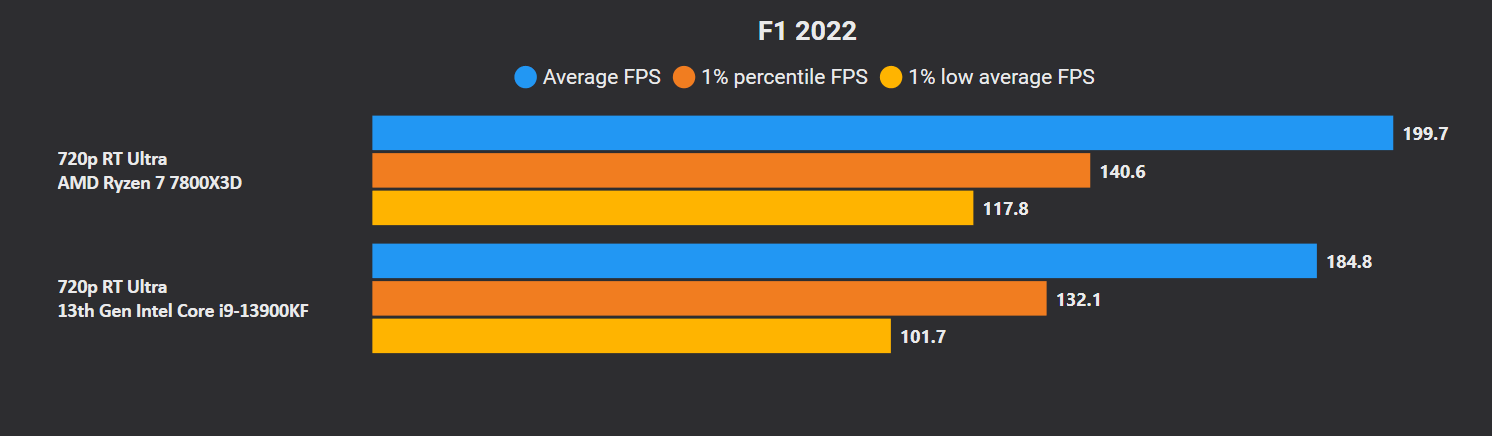
F1 2022 behaves the same as it did with rasterization. The Ryzen 7 7800X3D is slightly faster with similar 1% lows.

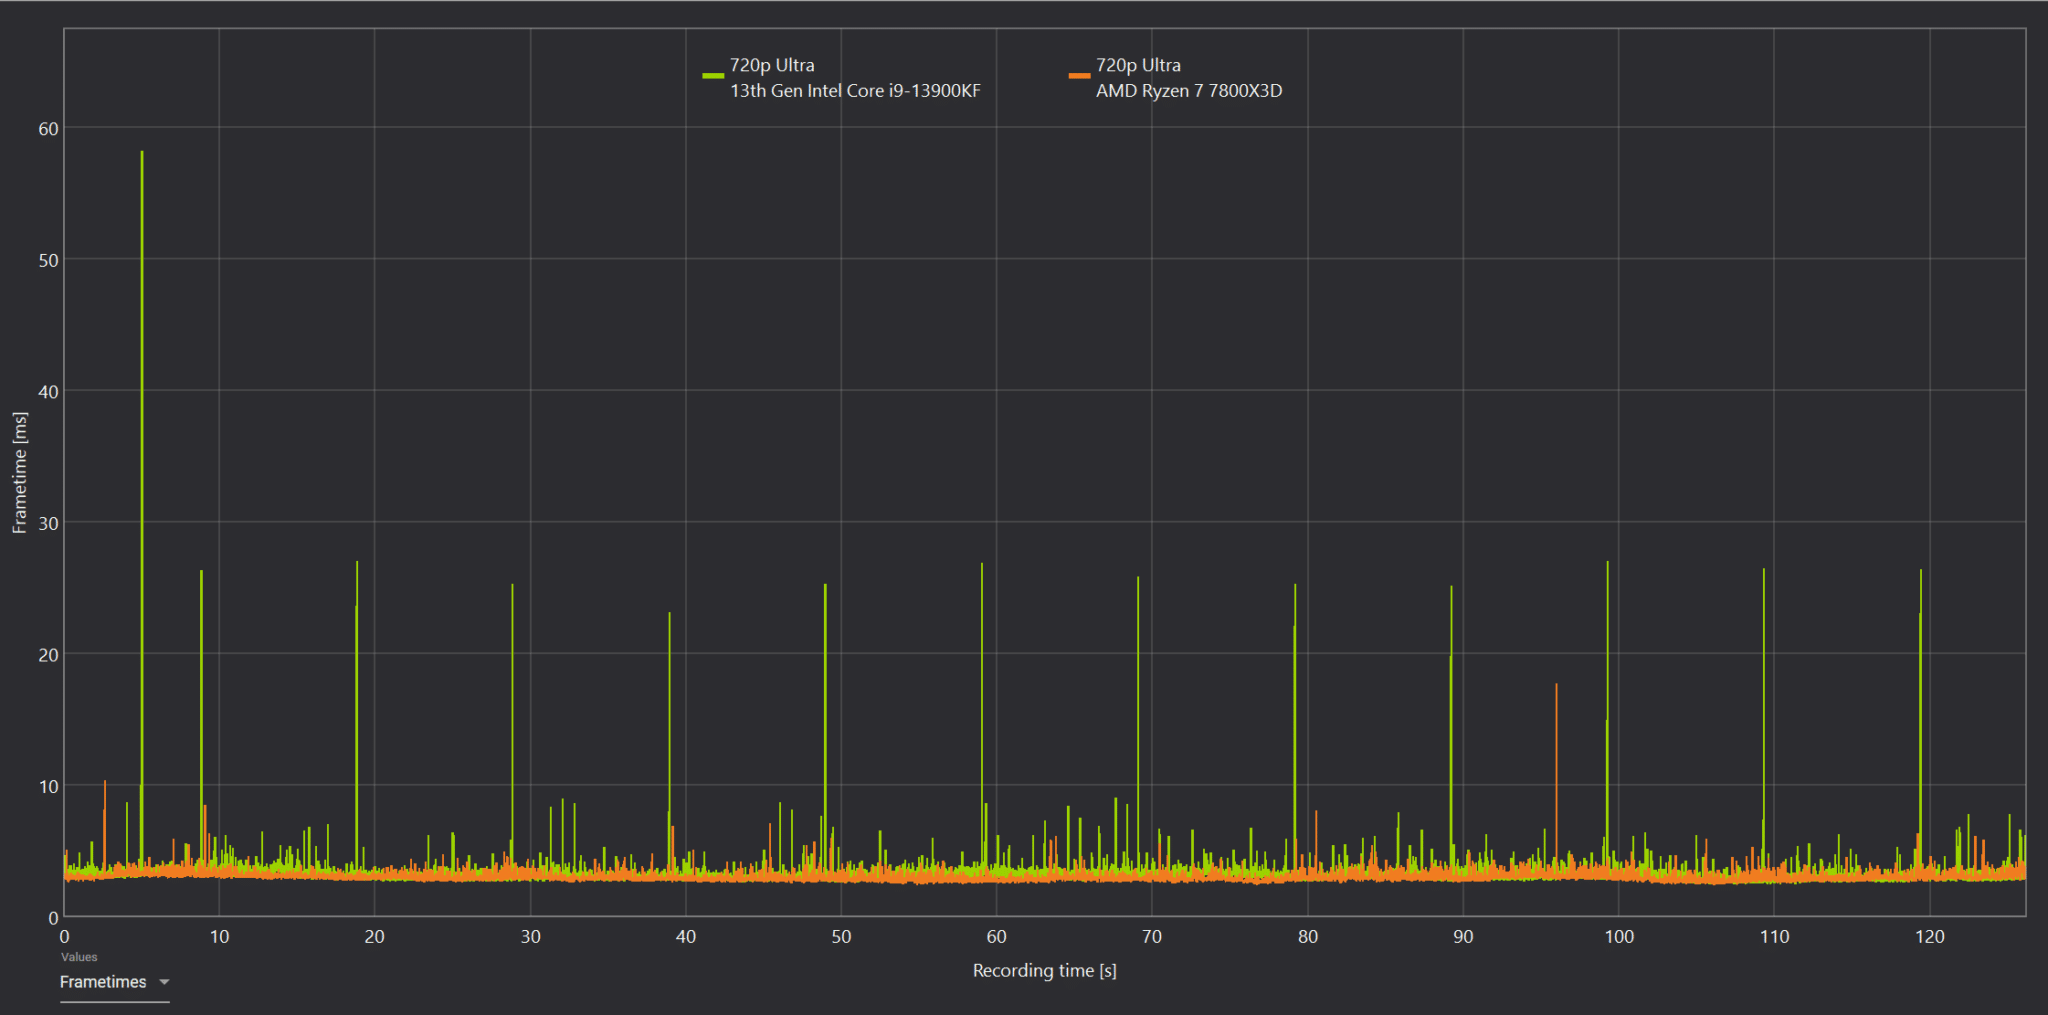
The frametime graph reveals the spikes responsible for the Intel Core i9-13900K’s loss. The 7800X3D has a significantly cleaner graph.
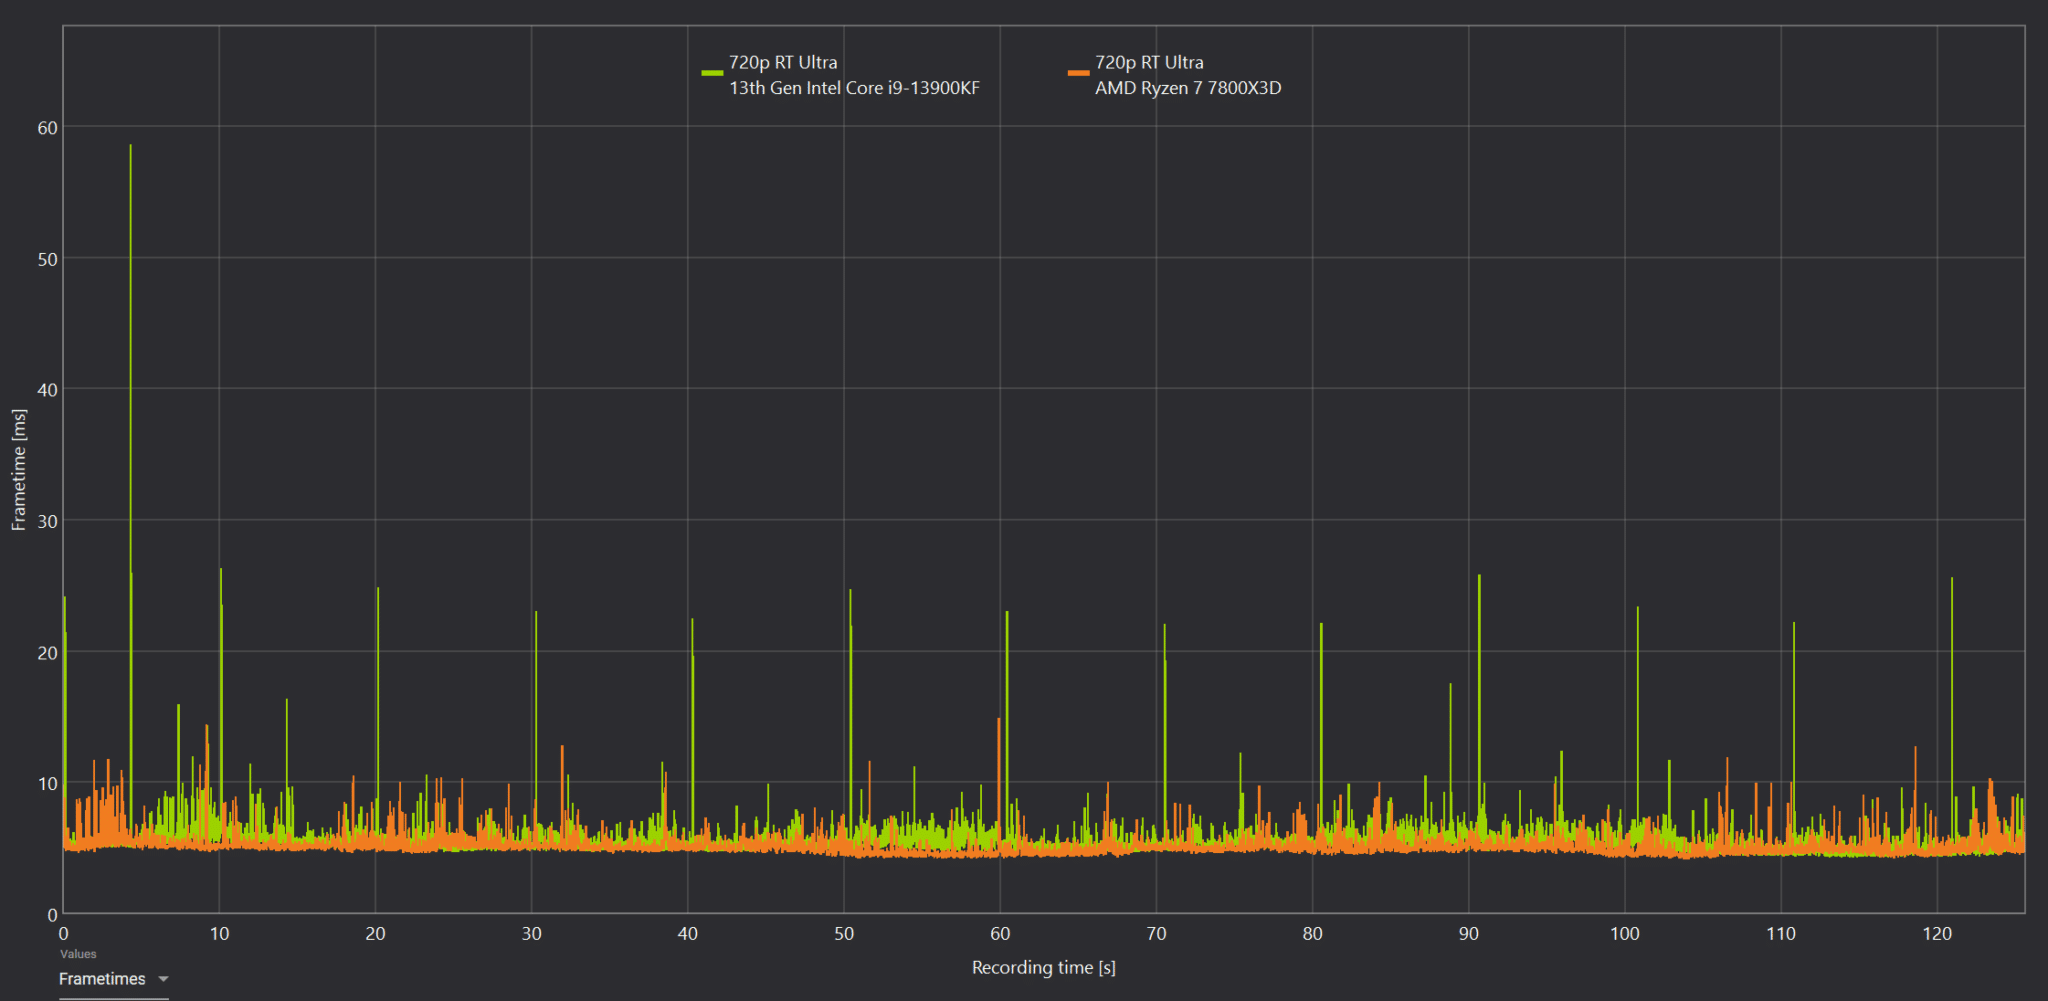
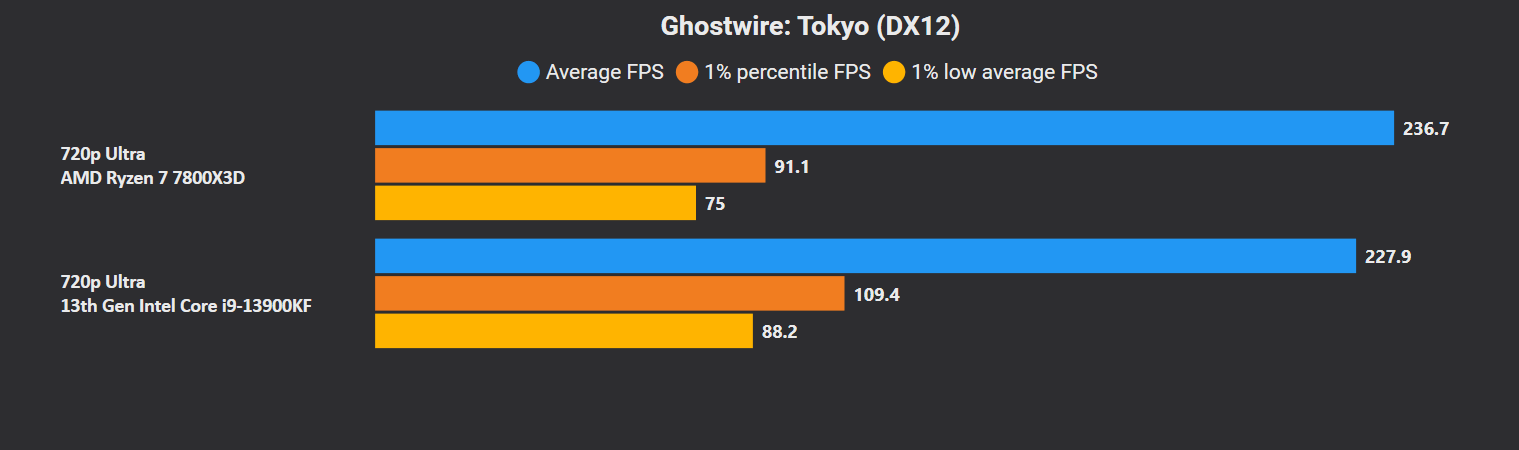
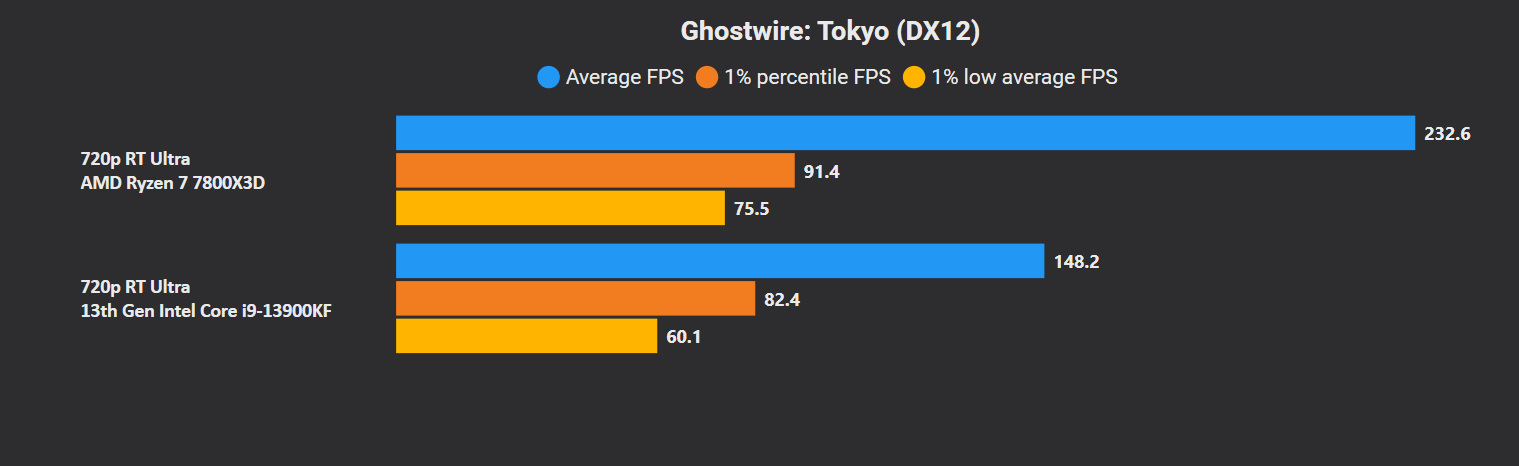
Ghostwire Tokyo is the third consecutive ray-traced title to favor the Ryzen 7 7800X3D. It is 57% faster on the X3D CPU with comparable lows.

The two CPUs produce nearly identical graphs, barring one over-the-top spike for the Core i9-13900K.
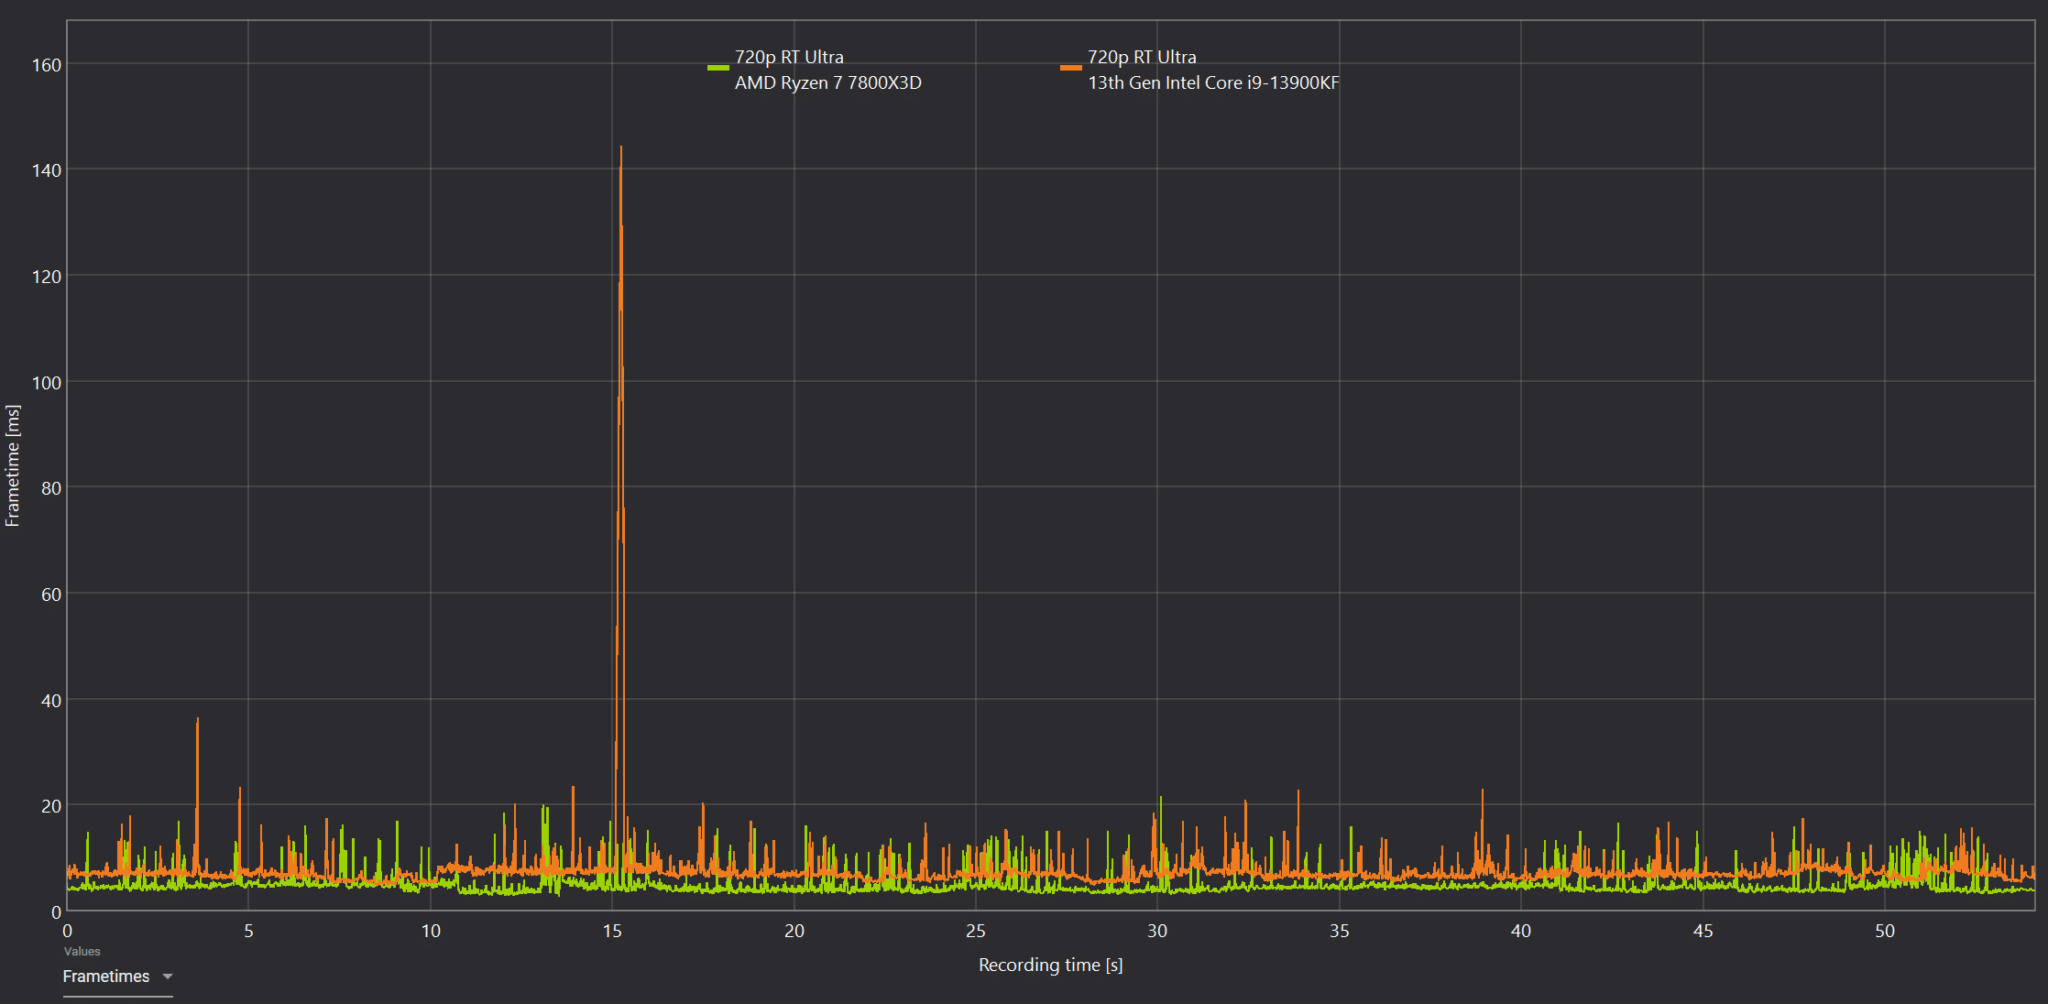
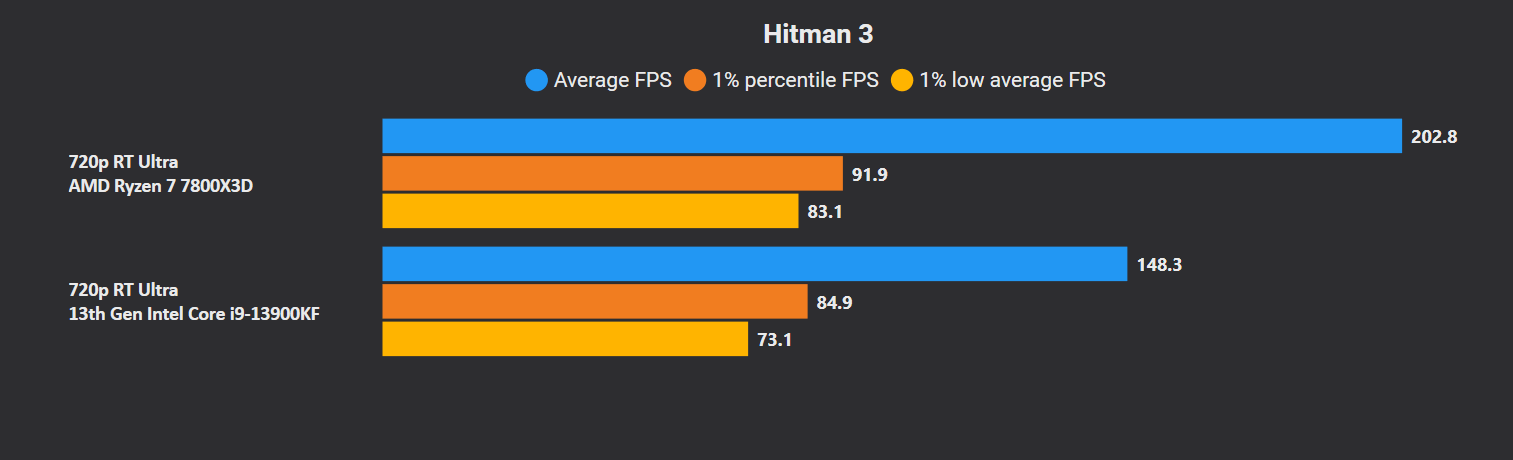
Hitman is the fourth consecutive ray-traced title to favor the Ryzen 7 7800X3D. It is 37% faster than the Core i9-13900K on average with similar lows.

Hogwarts Legacy is a slim victory for the Ryzen 7 7800X3D with notably higher lows. The Core i9-13900K faces a bit of trouble in the second half of the benchmark that cost it this title.

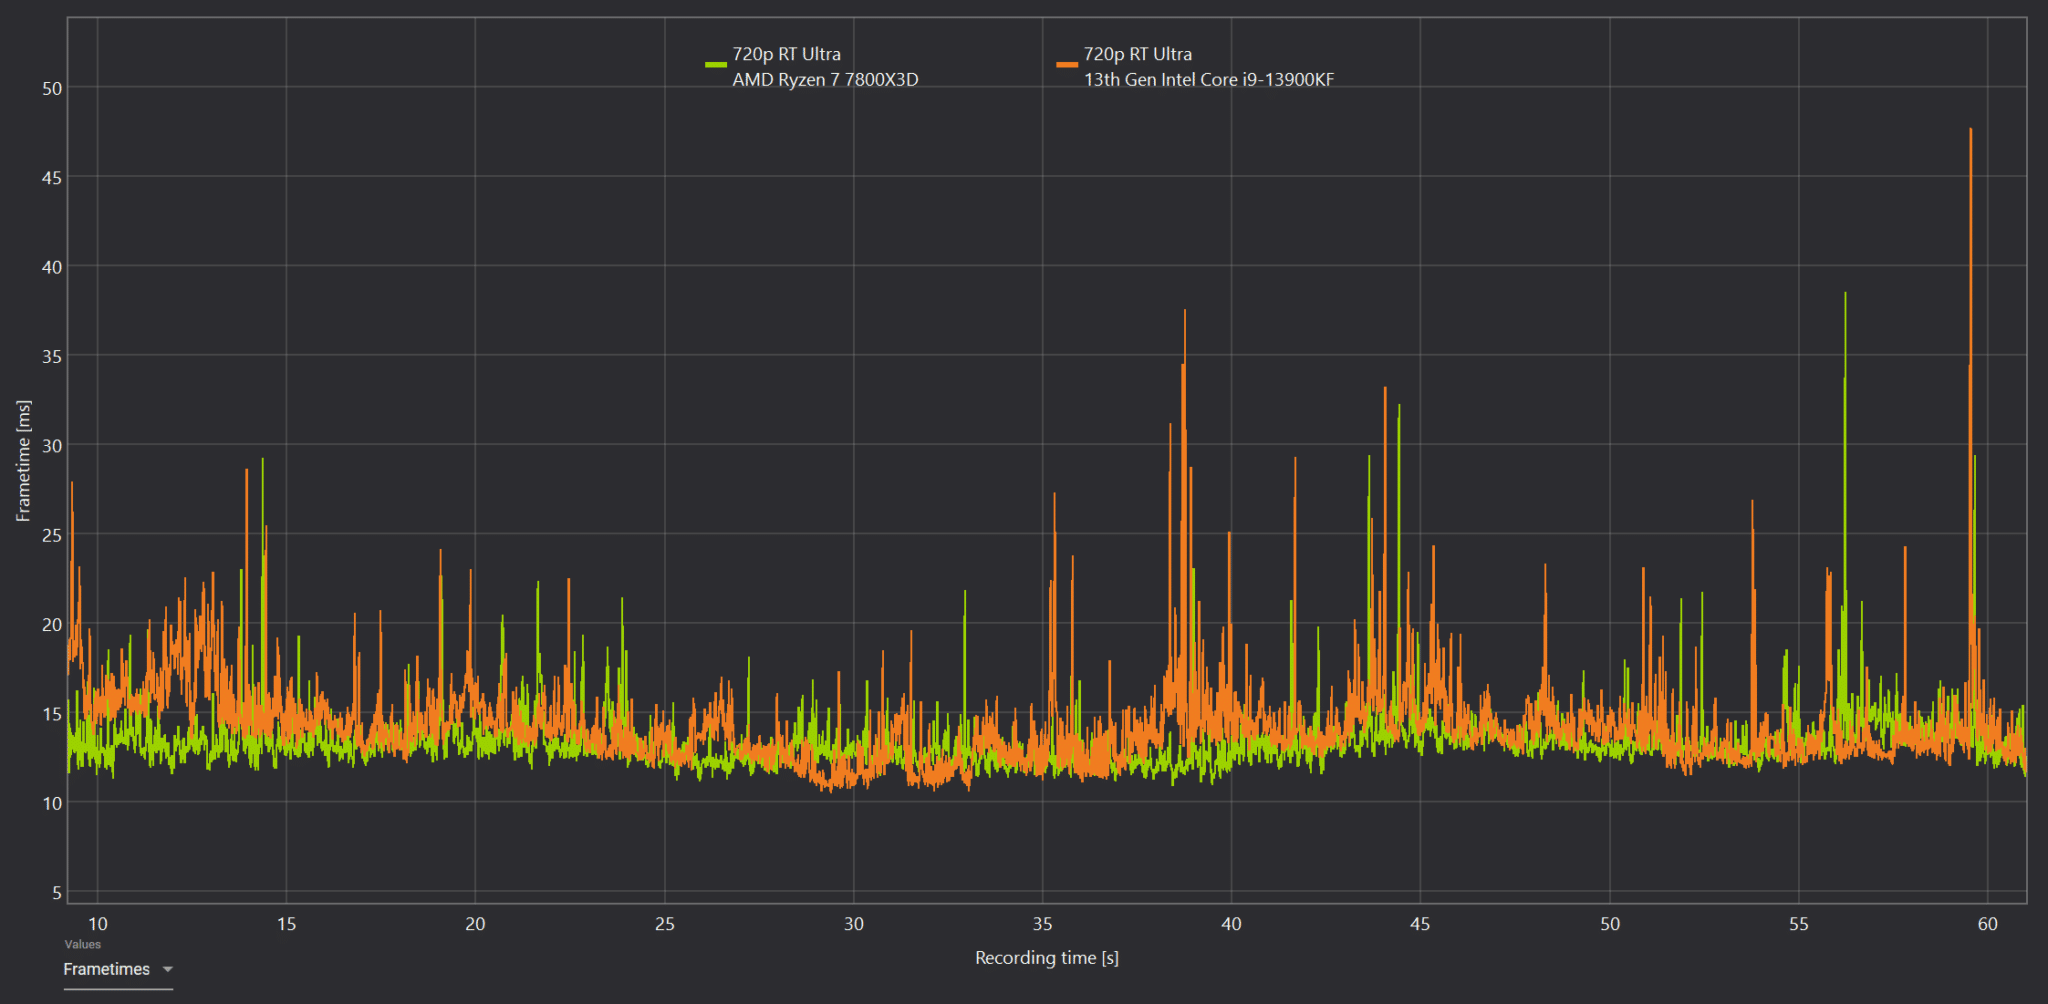
Metro Exodus stutters like crazy on Ryzen processors. Yet, the averages aren’t that far apart. This one goes to the Core i9-13900K.

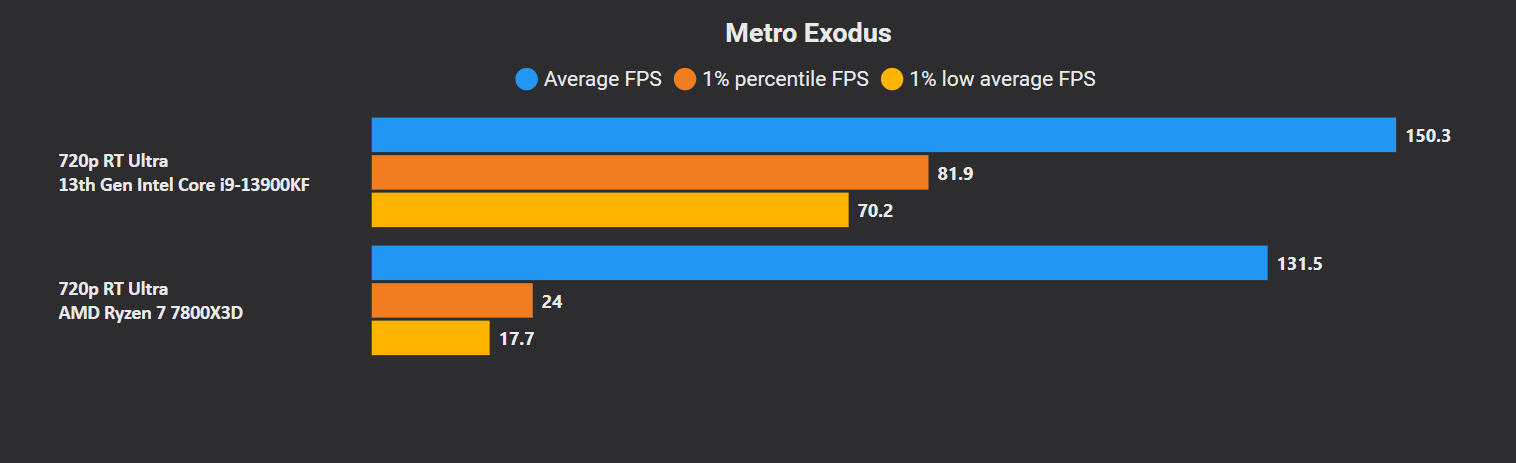
At the Extreme Quality preset, ray-tracing is a death sentence for the 7800X3D.
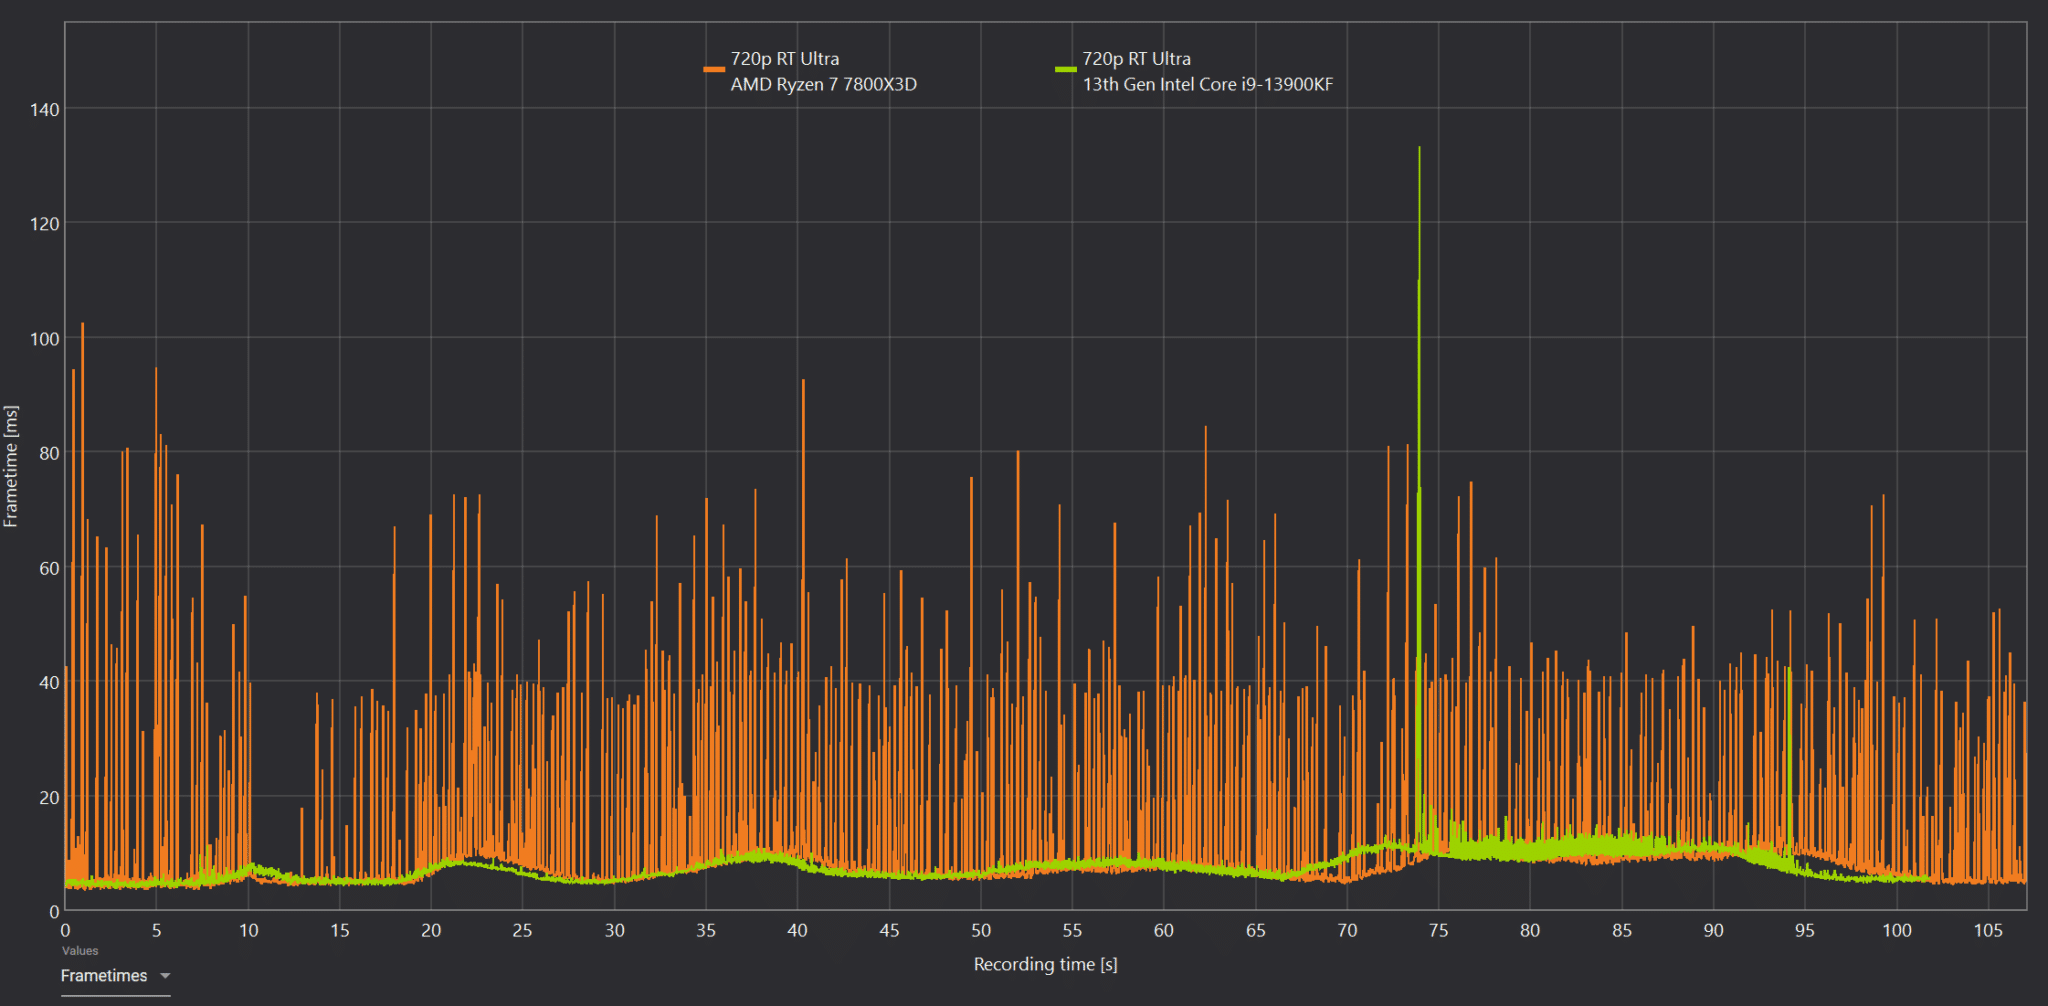
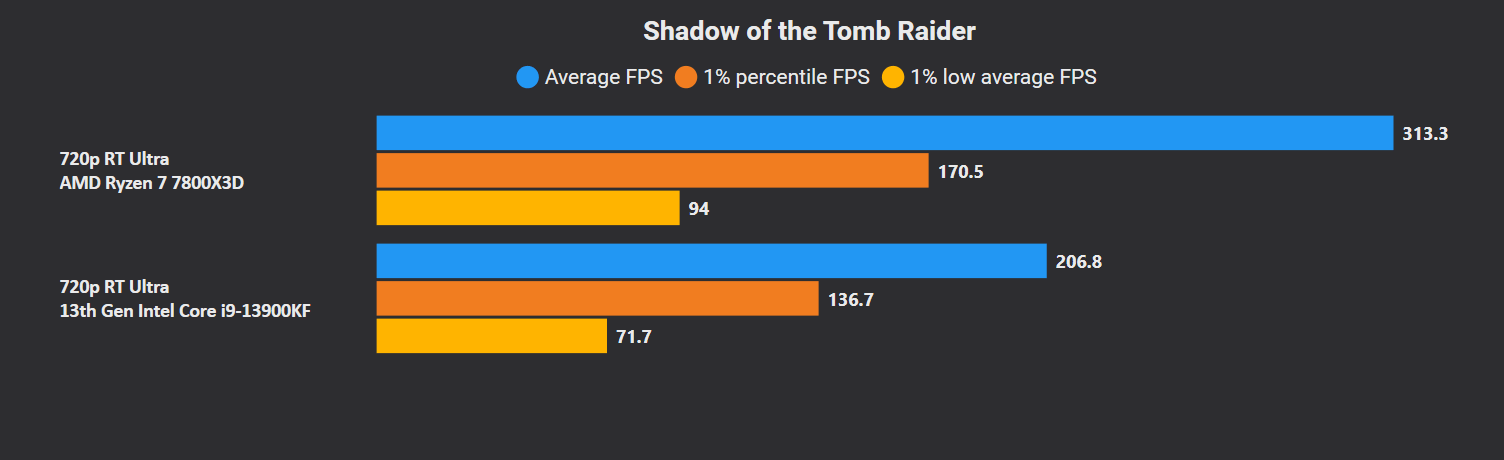
Shadow of the Tomb Raider is a decisive win for the 7800X3D. It holds a commanding 51% lead over the Core i9-13900K. The frametime graphs are quite similar.

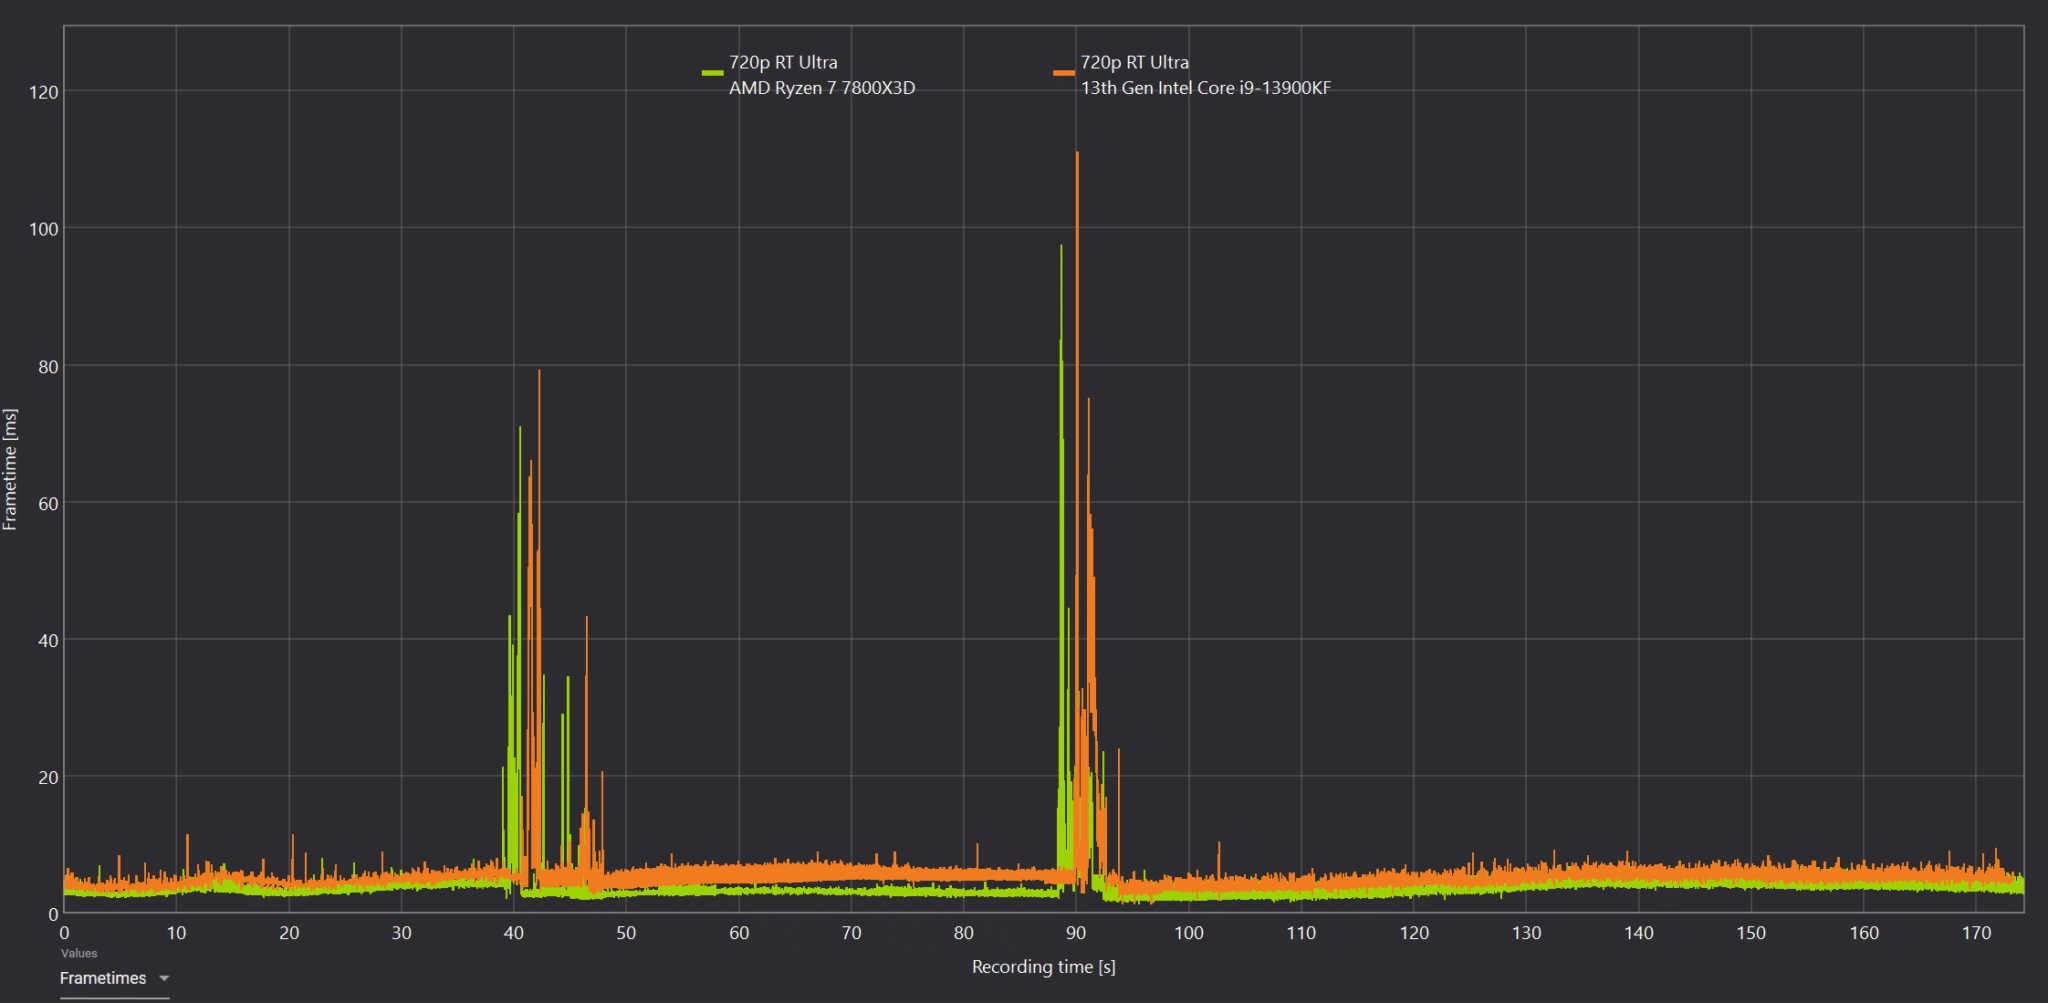
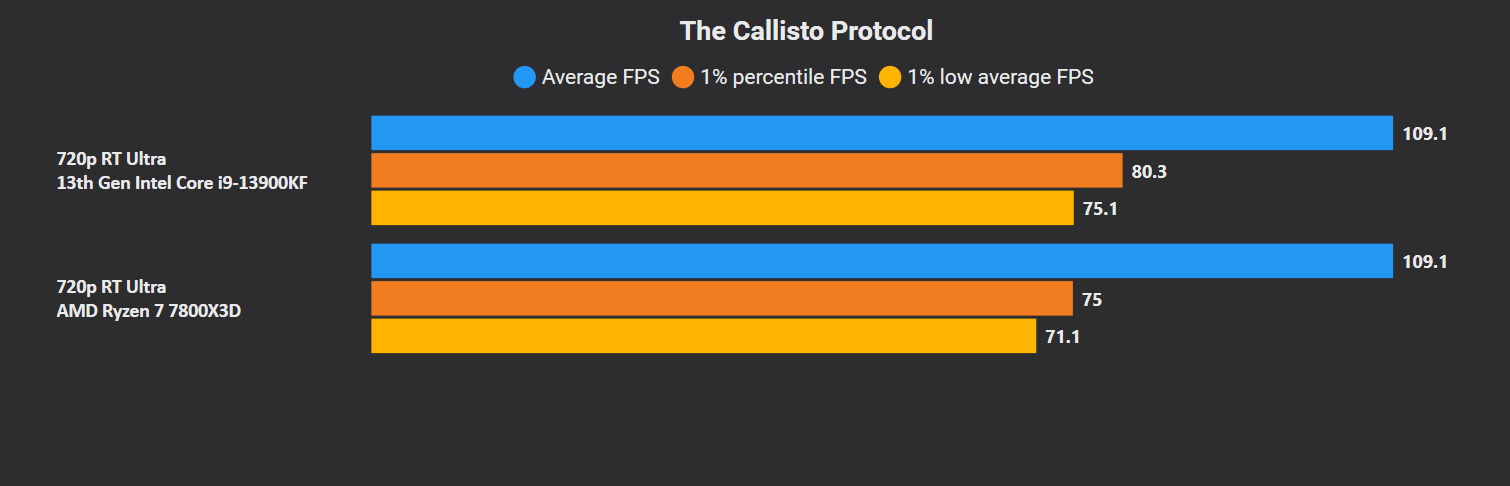
And at last, “The Callisto Protocol” is the concluding title in the ray-tracing test suite. Once again, despite being an AMD partner title, the Core i9-13900K wins. Barring a few spikes, the frametime reveals smoother frame pacing for the latter.


And that’s five wins for the Core i9-13900K and six for the Ryzen 7 7800X3D. Pretty much a tie.